Project Budget Tab
- Former user (Deleted)
- Shivam (Deactivated)
- Thomas Sherman (Deactivated)
- Former user (Deleted)
The Budget tab is where you define time and cost budgets for a project. Budgets are powerful tools for ensuring that your project is delivered on time and within costs. Projector supports multiple metrics like Hours, RDC, or BAR that can be broken down further by dimensions like Resource or Task. This allows you to look at your budgets from a high level perspective - How am I doing overall? To a granular perspective - How well is Mike staying in budget? Learn how to create new budgets in the following articles.
Additional Resources
The Topic of the Day: Budgets webinar is a great resource to learn about best practices around creating, tracking and monitoring budgets in Projector. (go to 19:20)
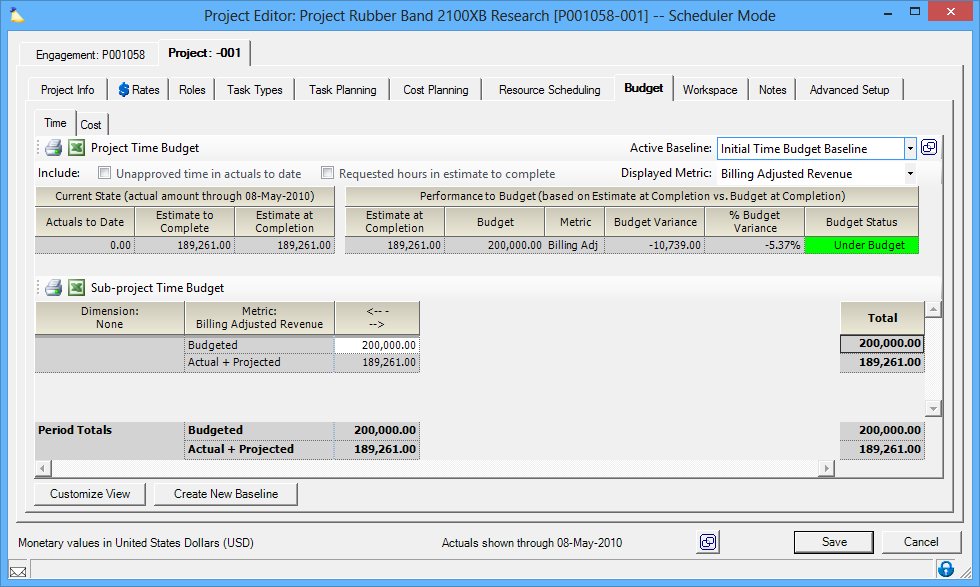
This tab is reached by opening a project from the Project Browser and selecting the Budget subtab.
Permissions and Settings
To create a project budget you must have one of the following permissions:
- You are the engagement manager, project manager, or on the PM Team and you have the stage based permission Create Baselines
- You have the cost center permission Maintain Projects and Engagements
To edit or delete a project budget you must have one of the following permissions:
- You are the engagement manager, project manager, or on the PM Team and you have the stage based permission Edit and Delete Baselines
- You have the cost center permission Maintain Projects and Engagements
The separation Create and Edit/Delete permissions allows you to setup an initial baseline, for example, an hours based budget, and disallow your PMs from changing it into a different type of budget.
The default budget for a new project is determined by the engagement type. To change the default see the engagement type editor's budget tab.
When your projects reach certain budget thresholds notifications may be sent out. See the Budget Alerts Editor to configure these.
To change active baselines requires both Create and Edit privileges.
Baselines
A baseline is a budget that defines what you plan to do for this project. You can have multiple baselines. With multiple baselines you can change your budgets as the project progresses, while preserving old budgets. This allows you to see how the project evolved over time and how well your budget forecasting played out. Each baseline can have multiple metrics. With multiple metrics you can look at numbers like RDC or BAR side-by-side. In addition, baselines can be broken down to a more granular level by adding a dimension like Resource or Task. As you can see, baselines are extremely flexible. For a more in depth explanation of baselines - please see Create a Time Baseline and Budgets, Tracking, and Alerts.
New projects inherit a default budget type from its engagement type. New projects have an infinite budget amount, intended to not harass organizations who don't care about tracking to budget. You can imagine it being pretty annoying if an organization who doesn't care about budgets gets a budget e-mail alert as soon as the first hour gets logged because the budget amount defaulted to zero.
Creating a new budget baseline, however, is different. When a user creates a new baseline, she is indicating that the organization does care about the budget, and thus takes on the responsibility of putting something in reasonable for the budget amount.
Create a Baseline
Click the Create New Baseline button in the lower left of the budget editor.
Edit a Baseline
Once a baseline is created, its fundamentals can no longer be edited. For instance, dimension, time period, metric, etc. This is to preserve the historical record of what you used for baselines. The only thing that remains editable is the budgeted amounts. There are three types of budgets possible:
- No budget (infinite budget) - leave the budget amount as blank
- Zero - enter zero
- Positive - enter any number greater than zero
Delete a Baseline
Click the (  ) icon to open the Baseline Browser. Only inactive baselines can be deleted. If you want to delete an active baseline you will first need to create a new one, make it active, and delete the old one.
Manage Baselines
Click the ( ) icon to open the Baseline Browser. From here you can create new baselines or delete old baselines.
Settings
In the upper section you determine which baseline you are interested in, what metric (form of measurement) you want, and whether unapproved time or requested hours should affect the grids.
Control | Description |
|---|---|
Active Baseline | From the dropdown choose the baseline you are interested in. These are typically time-phased, showing your projected budget at different points in the project's life cycle. See Create a Time Baseline for an example. To change active baselines requires both Create and Edit privileges. |
Displayed Metric | Billing Adjusted Revenue, Contract Revenue, Resource Direct Cost, Hours, or Chargeable Hours. The available options depend on the Active Baseline selected. |
Unapproved time in actuals to date | Time that has been submitted, but not yet approved should contribute to your actual data. |
Requested hours in estimate to complete | Time that has been requested, but not yet approved should contribute to your projected data. |
Grids
These three grids show you information about the projects performance to date, how well that performance matches your budget, and allows you to edit your budgets
Current State Grid
Base on the Use Actuals Through Date, this grid shows information about what has been done so far and what is left to be completed. The unit shown (money or hours) is based on the selected metric in the Performance to Budget Grid.
Current State (ATD) | Description |
|---|---|
Engagement/Project | Engagement code/name or project code/name. |
Actuals to Date | Actuals consist of Approved time or cost cards up to the date in the grid header |
Estimate to Complete | Projections consist of Booked time or Planned costs after the date in the grid header |
Estimate at Completion | The total of the Actuals to Date and Estimate to Complete. |
Performance to Budget Grid
The performance to budget grid shows how well your project is performing overall compared to your baseline and metric. To change Baselines or Metrics, use the dropdown lists in the upper right.
Performance to Budget (ETC or ATD) | Description |
|---|---|
Estimate at Completion | The total of the Actuals to Date and Estimate to Complete. |
Budget | See the budget section discussed above for more information. |
Metric | See the metric section discussed above for more information. |
Budget Variance | The difference between the Actuals to Date and |
% Budget Variance | The difference between the Estimate at Completion amount and the budget and reflects the amount by which it is estimated that the budget will be off. |
Budget Status | Reflects the current budget status according to your budget alerts |
Budget Baseline Grid
This grid shows your budget performance broken down by the baseline's dimension. For example, you can see how well each individual resource is performing to budget. You can show additional detail in this grid by clicking on Customize View and ticking off additional rows to display. You can also enable/disable time-phased totals from the customize screen.
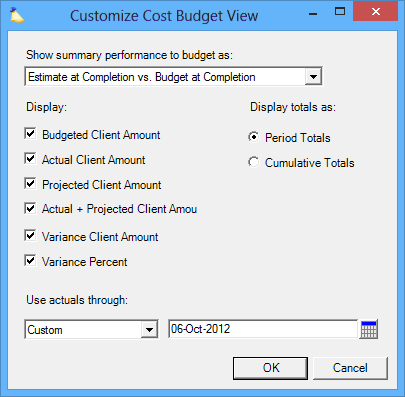
Customize View
The customize view screen allows you to control the level of detail that you see as well as how you want to view the data. Depending on whether you are customizing the Time subtab or the Cost subtab, one of the following two screens is shown. The information is essentially the same, but one references revenue while the other references disbursed amount.
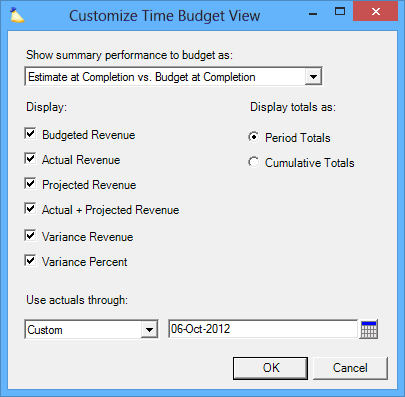
Summary Performance
Summary Type | Description |
|---|---|
Estimate at Completion | An estimate at completion is based upon the work you have done so far, plus the work you have booked. This is useful for flagging when a project is starting to go over budget. |
Actuals to Date | Actuals to Date represent the work you have done so far. This is useful for letting your managers know when your budget has been burned up by a certain amount. For example, when half your budget has been consumed. |
In addition you specify the Use Actuals Through Date here. Please see the help link for more information about this date.
Display Totals
Choose either Period Totals or Cumulative Totals. Period totals are used when Project Managers are looking to analyze run rates, while Cumulative totals are used when PMs are looking to understand the cumulative performance over and up to a particular point in time.
Display
Tick the checkbox for each data point you want to view on the budgets tab.
Budgeted | This is an editable field where you can enter the budgeted amount |
Actual | The amount of approved time or cost up to the use actuals through date |
Projected | The amount of booked time or planned costs after the use actuals through date |
Actual + Projected | Total of Actual and Projected rows |
Variance | Difference between budget and actuals |
Variance Percent | Difference percent between budget and actuals |
Use Actuals Through Date
Use actuals through – Choose a date for reporting actual data. After choosing the date, all data displayed on and before this date will be actual time/cost information, while all information following this date will be projected data. To choose a date, you may select any of the options listed below. Note that the end of a week is based on the day chosen as the first day of the week in the initial setup for your organization.