Project Task Planning Tab
The task planning tab is used to manage Detailed Task Management in Projector. DTM is designed to support organizations that plan out delivery efforts at a detailed level and wish to track performance of delivery teams using those detailed plans. Projector's task planning functionality is not meant to be as versatile as dedicated project planning applications such as Microsoft Project. Rather, its strength lies in its ability to integrate typical project management activities into operational management functions such as planning, staffing, and analytical reporting. It also transfers the administrative burden of time and task status collection from the Project Manager to the delivery team, allowing the PM to instead focus on value-added activities. Finally, it provides real-time visibility of project health. The following four areas highlight some of the benefits of Projector's DTM module.
- Planning – Project Managers create hierarchical task plans that describe the tasks necessary to deliver a project. These task plans are constructed by modeling how much work is required to complete a task (effort), what resources are assigned to the task (allocation), and how long the task will take (duration). Projector allows planners to specify the timing of tasks in relation to other tasks - allowing the actual work completed to date to drive your plan.
- Staffing – From the task plan, Project Managers can understand what their staffing needs are and initiate the scheduling workflow by requesting resources or committing resources to their project. They have the flexibility to either use the task planning data as is or, as is often needed, perform a round of smoothing on the resource needs before requesting/booking resources.
- Time Entry – Once assigned to a task, resources see on both their dashboard and time entry screens tasks they need to complete. In addition they provide a valuable feedback loop of task completion progress.
- Performance Analysis – Project Managers collect time entered against tasks and can quickly visualize performance of the entire project team against the current task plan or against snapshots of the plan taken in the past.
Additional Resources
- In the Topic of the Day: Managing Projects in Projector Webinar, we provide a general overview of the task management and detailed budgeting features within Projector.
The area is reached by opening a project and choosing the Task Planning tab.
- Task Plan Tab — manage a detailed task plan by specifying effort, duration, and assigned resources
- Task Status Tab — visualize your project's performance to schedule and performance to budget
- Resource Plan Tab — convert your task plan into scheduled resources or view how your plan matches your available resources
- Task Details Form — view detailed analysis of individual tasks and make fine-grained changes to tasks
- Microsoft Project Import and Export — transfer data between MS Project and Projector
- Task Reassignment Form — swap out resources on a task plan
Permissions and Settings
To access detailed task management you must have the Project Management module enabled.
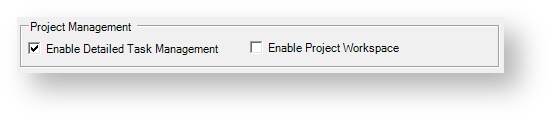
To turn on detailed task management, tick Enable Detailed Task Management on the Project Info Tab.
The following people can enable or disable DTM:
- Engagement or Project managers with the stage permission Edit Project Info
- Anyone with the cost center permission Maintain Projects and Engagements
Gantt Charts
If you are not familiar with Gantt charts, this section provides a quick overview. Gantt charts are frequently used by project managers to model activities (tasks) against a timeline. These activities can be sequential, meaning one activity cannot be started until the previous ends, or parallel, meaning multiple activities can be run simultaneously. These task interdependencies are then presented in a visualization that maps your tasks vs. a timeline. From this you can quickly see when task start/end. Projector offers a number of additional visualization features customized to our product.
Using DTM in Projector
So far you have only been given a high level introduction to DTM and some of the things it can accomplish. This next section's goal is to give you a hands on workflow that we would typically see a Project Manager use. You may use some or all of the following functionality.
Enable DTM
First make sure that DTM is enabled by going to the Project Info Tab and ticking the Enable Detailed Task Management checkbox. See the permissions section of this page if the checkbox is inaccessible.
Create a Plan
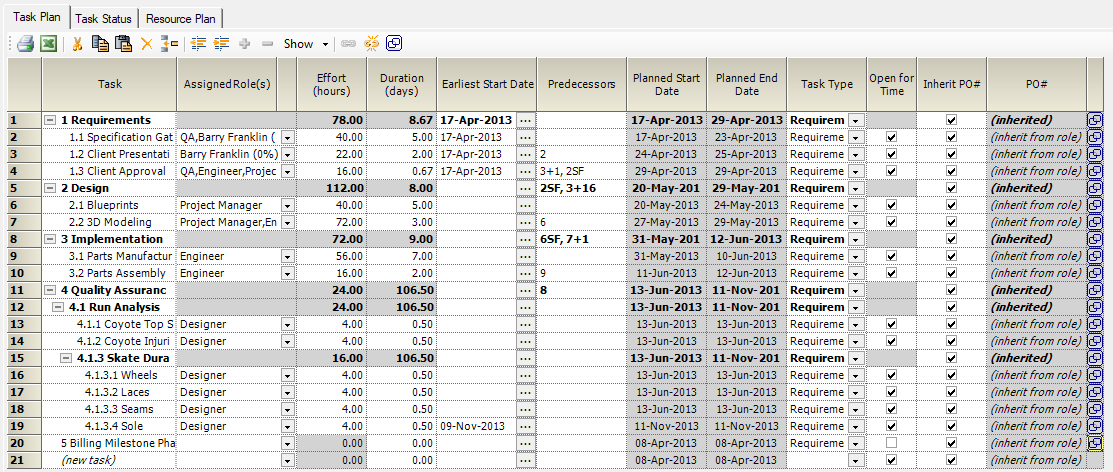
Most project managers start by defining a task plan. These are defined on the Task Plan Tab. You can either import an existing plan from Microsoft Project or create your own. In the screenshot below you can see an example project with four major phases in bold - Requirements, Design, Implementation, and Quality Assurance. Each phase has specific subtasks that define:
- Who
- When the task should start
- Number of hours to complete task
- Number of days to complete task (for example, working 4 hours a day - it would take 10 days to complete a 40 hour project)
For detailed help on creating task plans please see the Task Plan Tab documentation page.
Create a Baseline
Creating baselines is an important step in maintaining your project. As a project progresses it is typical to find that you overestimated hours on one task while underestimating hours on another. You may shift hours or resources around to keep everyone working as efficiently as possible. When you make your initial plan, and tweaks thereafter, you should be creating a new baseline. You can then compare all your baselines to see how the project changed over time, identify incorrect estimates, and improve plans for the future.
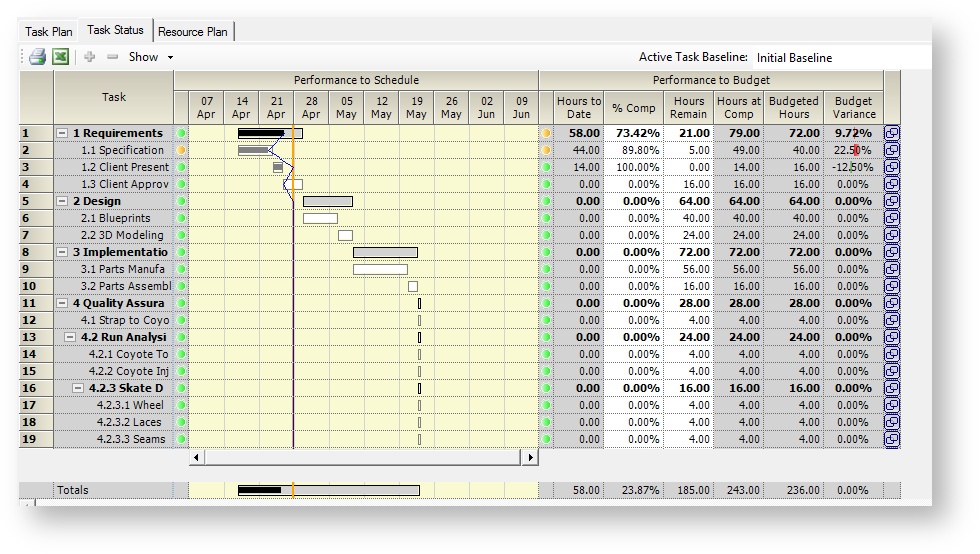
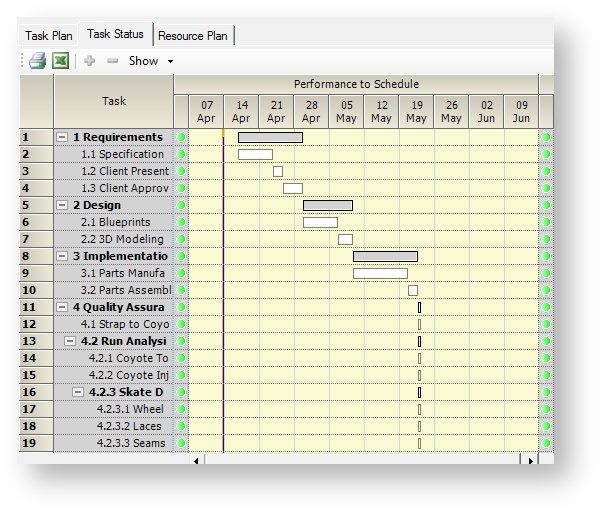
The Task Status Tab also gives PMs a quick visualization into performance. In the screenshot on the left you can see an initial plan. Everything is in the future, neatly showing when you expect tasks to start and finish. In the screenshot on the right the project is two weeks in as shown by the vertical orange bar. A blue line runs along this bar. When the blue line falls to the left of the orange bar, tasks are taking longer than expected. When they fall to the right of the orange bar they are progressing more quickly than expected. In addition, convenient stoplight markers are shown for each task. In the screenshot on the right you can see task 1.1 is yellow because it took more time than expected.
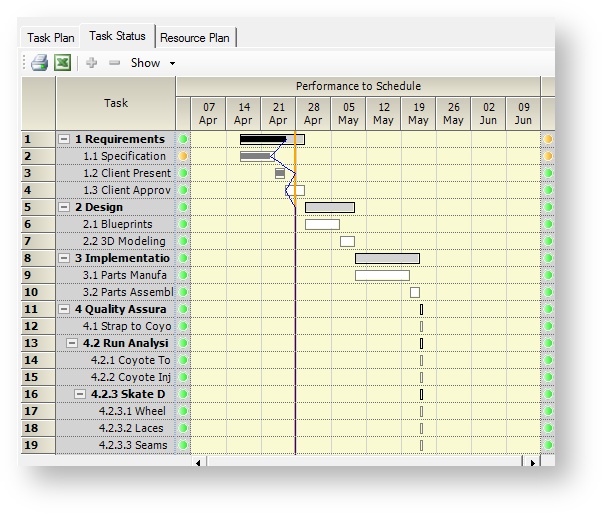
For detailed help on understanding the Task Status tab's visualizations and on creating baselines, please see the Task Status Tab help page.
Request or Book Resources
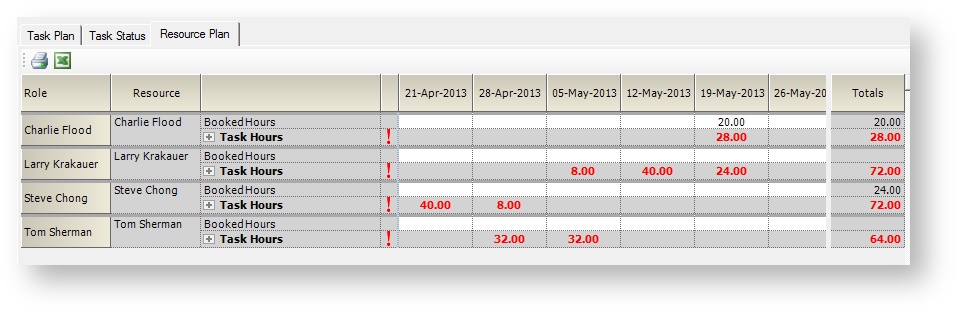
So you have a plan and a baseline - now you need to staff your resources on the project. Projector makes this easy. On the resource plan tab Projector displays the number of hours that each resource must work to complete all their scheduled task hours. Hours in red tell you that more are needed to fully staff the plan. Right click on any role and choose to Request/Book the hours. The hours change to black once enough have been allocated. See the Resource Plan Tab for more information on requesting and booking hours according to a task plan.
Enter Time
Once the time has been booked your resources will see the project and their assigned tasks automatically added to their dashboard and time entry screens.
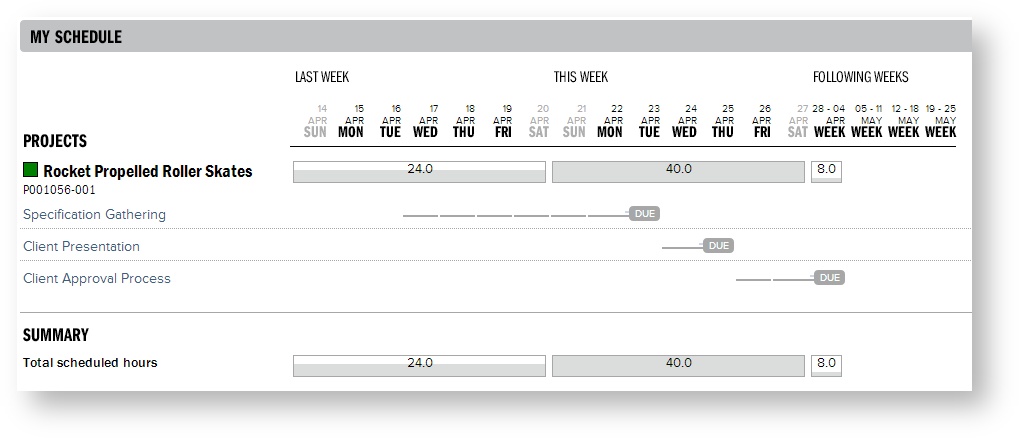
Time entry shows their tasks for each project. A blue bar shows the days they are expected to be working on that task. A DUE badge shows when the task is expected to be completed. Finally, they will see LATE badges when tasks are not completed on time.
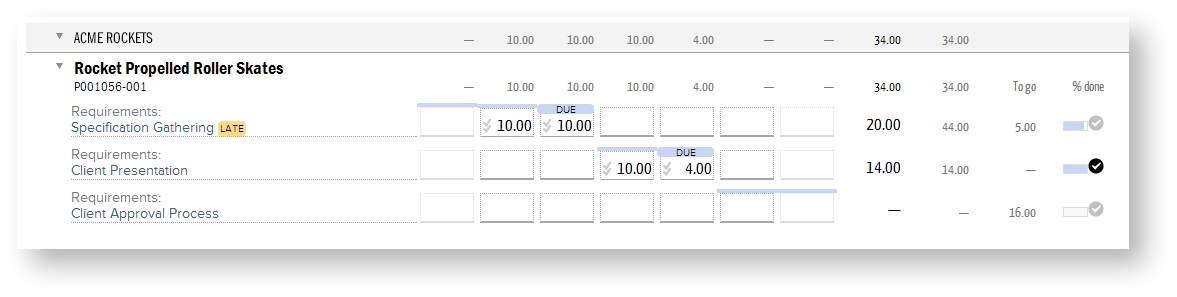
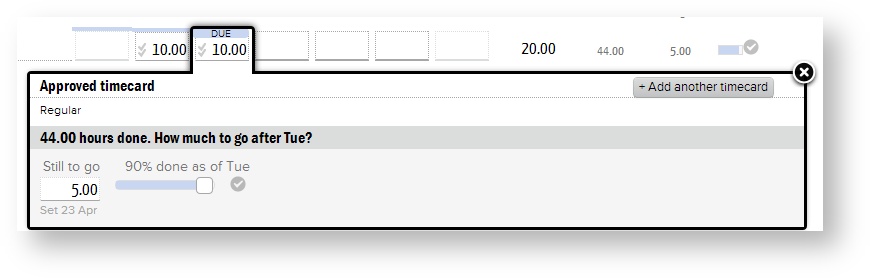
While working on their tasks, your resources have the ability to override the percent complete value. For example, in the picture below we can see a task with the following properties:
- the PM thought it would take forty hours
- task should be completed by Tuesday
- So far the resource has entered 44
- The resource reports that the task requires 5 more hours to complete
- Now when the PM looks at the Task Status tab for a visualization of task performance, he will see that the task has gone over budget, but is nearly complete.
Review Task Performance
Adjust Task Plan
Reports
You can often find a field called Task in reports like the Ginsu to run analytics. But for performance analytics you should use the specialized Task Analysis Report. The report highlights how project teams are doing on tasks with respect to performance to budget or performance to schedule.