Baseline Variance Report - Data Fields
- Thomas Sherman (Deactivated)
- Former user (Deleted)
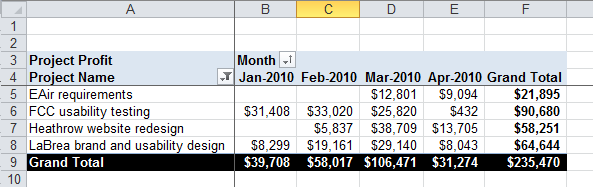
In Projector a data field represents the information that you are interested in. For Excel Pivot Tables this information can be cross-referenced by the row and column fields to compile the data. In this image you see project profit organized by project name and month. Project Profit is the data field. Project Name is the row field. Month is the column field. If this sounds confusing, read our introductory article on pivot tables.
Data Fields
Field |
Field Category |
Description |
|---|---|---|
Actuals to Date |
Actuals to Date Metrics |
Amount of metric (e.g., hours, RDC, etc.) expended through the actuals cutoff date |
Budget |
Budget Fields |
Budget amount, measured using the specified metric |
Budget Remaining |
Actuals to Date Metrics |
Budget - ATD |
Budget Remaining % |
Actuals to Date Metrics |
Budget - ATD, as a percentage of the budget |
Budget Variance |
Estimate at Completion Metrics |
ETC - Budget |
Budget Variance % |
Estimate at Completion Metrics |
ETC - Budget, as a percentage of the budget |
Estimate at Completion |
Estimate at Completion Metrics |
Amount of metric (e.g., hours, RDC, etc.) planned to be expended over the life of the project |
Estimate to Complete |
Estimate at Completion Metrics |
Amount of metric (e.g., hours, RDC, etc.) planned to be expended after the actuals cutoff date |