Project - View Dashboards
- Thomas Sherman (Deactivated)
- Chris McFarlane (Deactivated)
- Bettina Borces
View business intelligence dashboards configured for your installation.
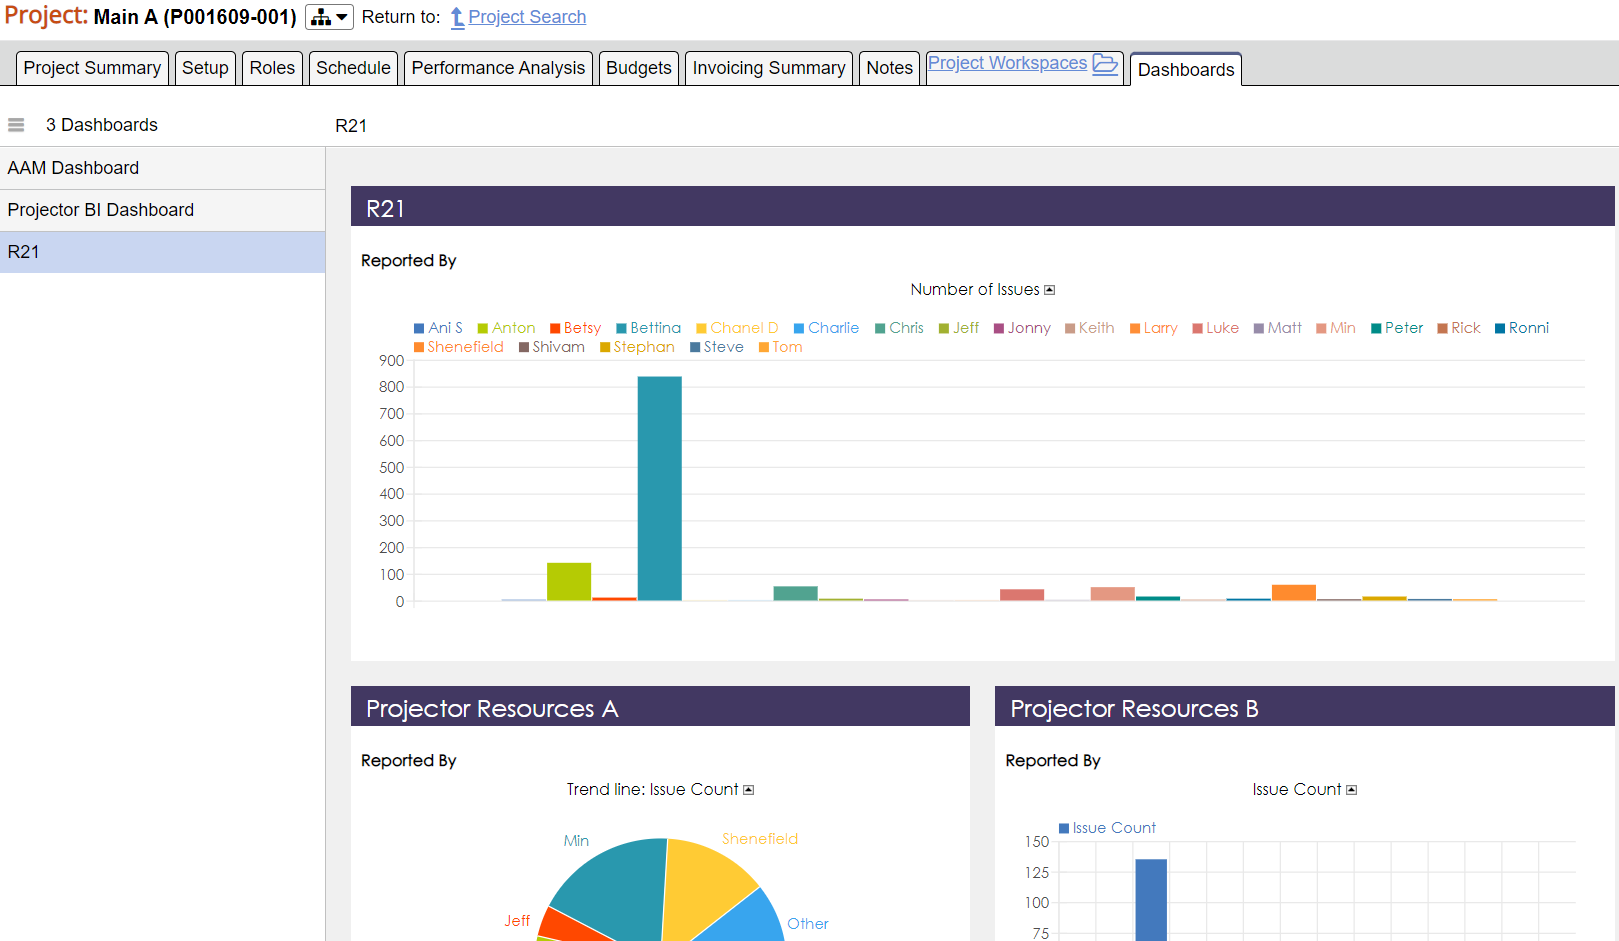
Dashboards are the consumable part of ProjectorBI. They are the final visualizations that your Projector users look and interact with. A dashboard is composed of dashlets. Each dashlet contains different types of information. Most of your dashlets will come from views in your reports, but some may be custom dashlets like your company's RSS feed or an activity feed of recently updated reports.
The dashlets on a dashboard are interactive. You can interact with a pivot table, view the numbers that compose a line chart, or drill down into geographic regions.
Users consume dashboards directly in ProjectorBI, from project landing pages, performance dashboards, or from project workspace dashboards.
Permissions and Settings
Dashboards are viewable in four areas of Projector.
- Topics | Configure | Advanced Analytics | Dashboards - this is the general dashboards page and is available to everyone
- Topics | Measure | Performance Dashboards - these are dashboards that have been specifically shared to a user and are visible through Projector Web. To learn more see Dashboards.
- Topics | Project Workspaces - these are dashboards that are configured to show data in project workspaces. To learn more see Workspace Dashboards.
- Topics | Projects | Dashboards - these are dashboards that are configured to show data in the project landing page.
You can view a dashboard if:
- You are the owner
- It has been shared to you
- It has been published and you are viewing it through either Topics | Performance Dashboards or via Project Workspace Dashboards.
A published dashboard is a read-only view of a dashboard. You cannot interact with it by drilling down,nor can you browse the back end data that comprises it. Only dashboards that have been published are viewable under Performance Dashboards or Workspace Dashboards.
Any Projector user with the general permission Enable user in advanced analytics module can create a dashboard. However, a user can only add dashlets from reports that are shared to them.
Dashboards are broken up into two categories. My Dashboards and Shared Dashboards. My dashboards are ones you own. You have complete control over them. Shared dashboards somebody else owns. They can grant you view permission, no permission, or edit permission.
You can set your own Default Dashboard. The default is displayed whenever you visit your Dashboards menu item. Or when you visit the Performance Dashboards area of Projector Web.
Manage Dashboards
Common dashboard operations.
Add
Go to My Dashboards | New Dashboard.
Modify
Choose a dashboard from My Dashboards | Edit.
Publish
Choose a dashboard from My Dashboards | Share | Plain Dashboard | Enter alias and Set. Alias must be unique across all dashboards in your domain.
Copy
Choose a dashboard from My Dashboards | Edit | Share
Delete
Choose a dashboard from My Dashboards | Edit | Delete