User Types Editor - Dashboards Tab
This help page contains the list of filter parameters as well as other useful Projector BI documentation.
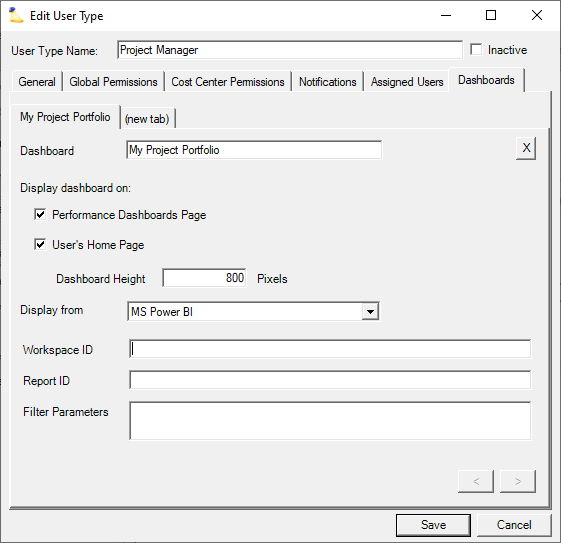
You can display custom business intelligence dashboards and visuals on a user's Home Page or Dashboards tab under Reporting. Dashboards are commonly used to show things like but not limited to:
- Company performance metrics
- Personal performance metrics
- Accrued vacation
- Utilization
This tab is only editable if you have the Projector BI module enabled.
ProjectorBI
Your installation comes with a base package of seven high level dashboards and one home page dashboard. You can use these dashboards as a starting point and build on top of it. You can create new dashboards or edit the existing ones to suit your business needs.
Projector BI primarily runs on top of Microsoft Power BI (Projector allows you to embed third party websites into Projector as well). Once these dashboards are embedded within Projector, users do not need a Power BI Pro license to view source dashboards, reports, or data sets in the Power BI workspace. The dashboards are shared with a user within Projector at a user type level where they are listed as Primary Users. Permissions for an individual user can also be controlled at a user level. Refer to the attached help doc below for more details.
| Control | Description |
|---|---|
| Dashboard | Name your dashboard. Users will see this name from their home page or performance dashboards. |
| IDs | To display a Power BI dashboard, the required IDs have to be entered. These IDs are a part of the URL for the published Power BI dashboards. Please refer to the above doc for further details
When a dashboard has an alias, it does not need to be explicitly shared to a user for viewing. Think of an alias as a way of publishing a dashboard to anyone viewing it via My Home Page. |
| Parameters | Parameters are used to filter a dashboard down to show specific data. The most common use case is to have a dashboard that shows data about many users, but when viewed via My Home Page it only contains data about the current user. To accommodate this, the following special short codes are supported.
Parameter filters only work if they are perfectly matched to a filter defined in Power BI. To add a filter, please refer to the above doc for further details. You are actually building a querystring here, so you can define multiple filters by using the "and" function. For example, DIM_Resource/Resource_x0020_Display_x0020_Name eq '{1}' and DIM_Project/Project_x0020_Code eq '{0}' You can also set up filters on external data sources by building an interim mapping table that maps something like resource display name to these other fields. For instance, if resources/users happen to own different products that are modeled as project UDFs, you might need to map name -> product in an interim mapping table and then link that to the project UDF. |