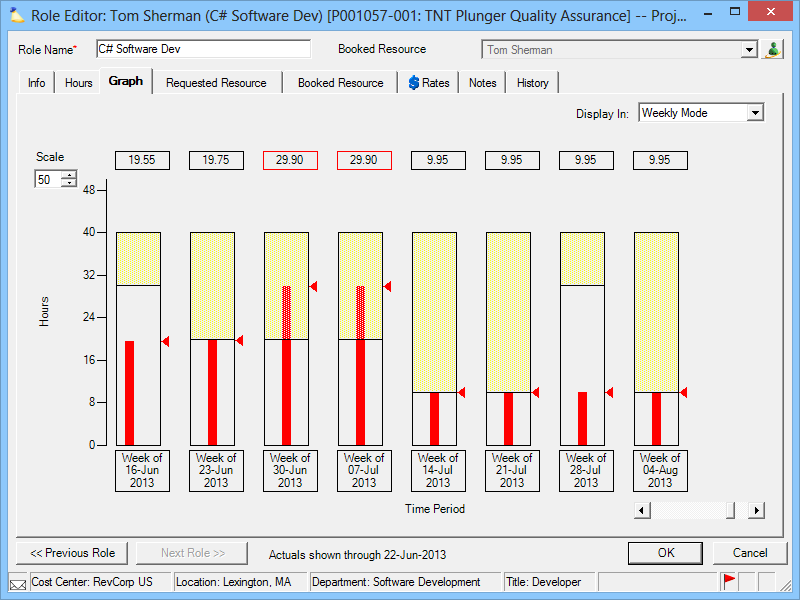
Role Graph Tab
The graph tab provides a graphical interface for viewing, requesting, and booking role hours. Hours are displayed on the vertical axis, and time periods along the horizontal axis. The graphs show you not only what is currently requested or booked, but also how much time the assigned resource is committed to on other projects. The visualization is particularly useful for analyzing resources that have "lumpy" allocations. That is, there schedule may vary quite a bit from week to week. Now you can see where peaks and valleys combine together to produce over or under utilization. Once you have identified any problem areas visually, you can shuffle hours around to optimize the resource's workday.
This is a subtab of the Role Editor. You will need to open the role editor to access it. Please see the Role Editor documentation for a list of locations that provide access.
Permissions and Settings
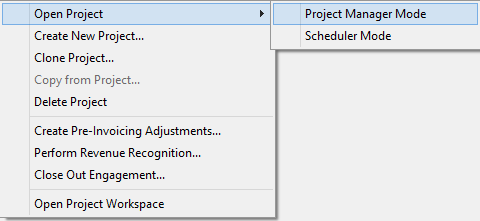
The changes you are allowed to make on this tab are dependent on how the project was opened. Roles can be opened in one of three modes - Scheduler Mode, Project Manager Mode, or View Project. Your current mode is displayed in the window title bar.

- Scheduler Mode allows you to schedule hours for the role
- Project Manager Mode allows you to request hours for the role
- View Project Mode is read-only
If you have sufficient permissions to both schedule and request hours, projector defaults to schedule. You can explicitly open a role in a certain mode by opening it via the project editor. Make sure that you right click on the project name and choose the mode.
The following people can request resources when the role is opened in Project Manager Mode:
- Anyone with the cost center permission Maintain Projects and Engagements
- Anyone with the cost center permission Request or Schedule Resources AND the stage permission Request Resources
- Engagement/Project Managers who have the stage permission Request Resources
The following people can book resources when the role is opened in Scheduler Mode:
- Anyone with the cost center permission Maintain Projects and Engagements
- Anyone with the cost center permission Request or Schedule Resources AND the stage permission Schedule Resources
- Engagement/Project Managers who have the stage permission Schedule Resources
Role Graph
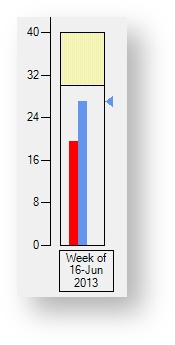
When viewing the role graph, the first thing you will notice are the colored bars. There are three colors displayed.
- The red bar shows the current requested hours
- The blue bar shows the current booked hours
- The yellow hatching shows bookings on other roles
The large black rectangle has meaning in and of itself. It represents the working hours for the assigned resource. In the screenshot at right you can see that this resource typically works forty hours a week.
There are also small triangles displayed in either red ( ) or blue (
 ) that correspond to their columns. These are drag handles. Drag them up or down to change the number of requested or booked hours. At the top of each column, a box shows you the number of hours the current column represents. If the box turns red, then the resource is overallocated.


The columns can represent either whole weeks or single days. Choose which one by using the Display In dropdown box. If you notice that a triangle is not filled in ( ), then you are in the wrong scheduling mode for that day/week and will not be able to drag it. Switch the Display In mode to enable the arrow. Alternatively, you can right click on the box over each column to change the scheduling mode. If you are unfamiliar with daily vs. weekly scheduling, please see our Scheduling Overview.
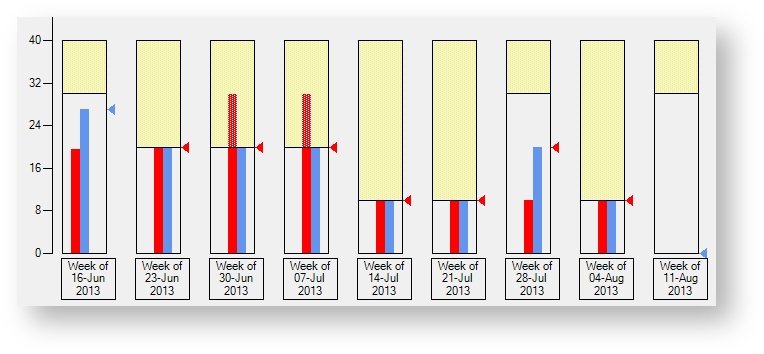
In the screenshot below you can see an example of someone with a lumpy request and how the scheduler accommodated it.
First look at the red bars. These were the hours requested by the PM. Notice how the request grows starting at week 3 and then tapers off rapidly in week 5.
Now look at the yellow bars. These are hours the resource is already booked on other roles. See how in weeks 3 and 4 the yellow and red intersect? That will result in a massive over allocation. Uh oh!
So the scheduler gave the redistributed the hours to fit the resource's availability. You can see this in the blue bars. The blue and yellow don't intersect, so no overallocations. The blue bar is now bigger than the red bars in weeks 1 and 7. That is because the scheduled shuffled hours to other weeks to prevent the resource from being over allocated.
Ctrl and Shift
You can modify multiple columns simultaneously. Hold the shift key and mouse click a beginning and end column to select everything in between. Then drag the arrows to adjust all columns together.
Or hold the Ctrl key down and click each column you want to adjust. This allows non-sequential column selection.
To choose all time periods press Ctrl A.
Adjust selected rows one hour at a time by using the up and down arrow keys. Hold Ctrl and press the up/down arrow key to increment by the smallest amount possible.
Notes
Notes are used to convey information between requestors and schedulers. Notes can be added in two places. You can add notes by editing the role and selecting the Notes tab. Roles with a note display a (  ) icon.
Or you can add notes directly to columns on this tab. A column with a note displays a small triangle in the upper corner.
Add Note
Right click on a column footer and choose Add/Edit Note. You may see an additional sub-menu that enables you to choose which day of the week for the note. This sub-menu appears when you are adding a note for a daily schedule person, but the view is not in daily mode.
Delete Note
Right-click on a column footer and choose Delete Note. You may see an additional sub-menu that enables you to choose the day for which the note will be deleted. This sub-menu appears when you are adding a note for a daily schedule person, but the view is not in daily mode.
View Note
Hover your mouse over the column footer and the note appears. If you hover over a daily scheduled person, but the view is in weekly mode, then you will see all the notes for that week.