Power BI - Import CSV
This help page teaches you how to connect Projector report data to a Power BI Data model. It will also show you how to edit and maintain the data.
Create Report
You'll first need to create a report in Projector so that you have data to pull into Excel.
- Go to your Reports tab in Projector
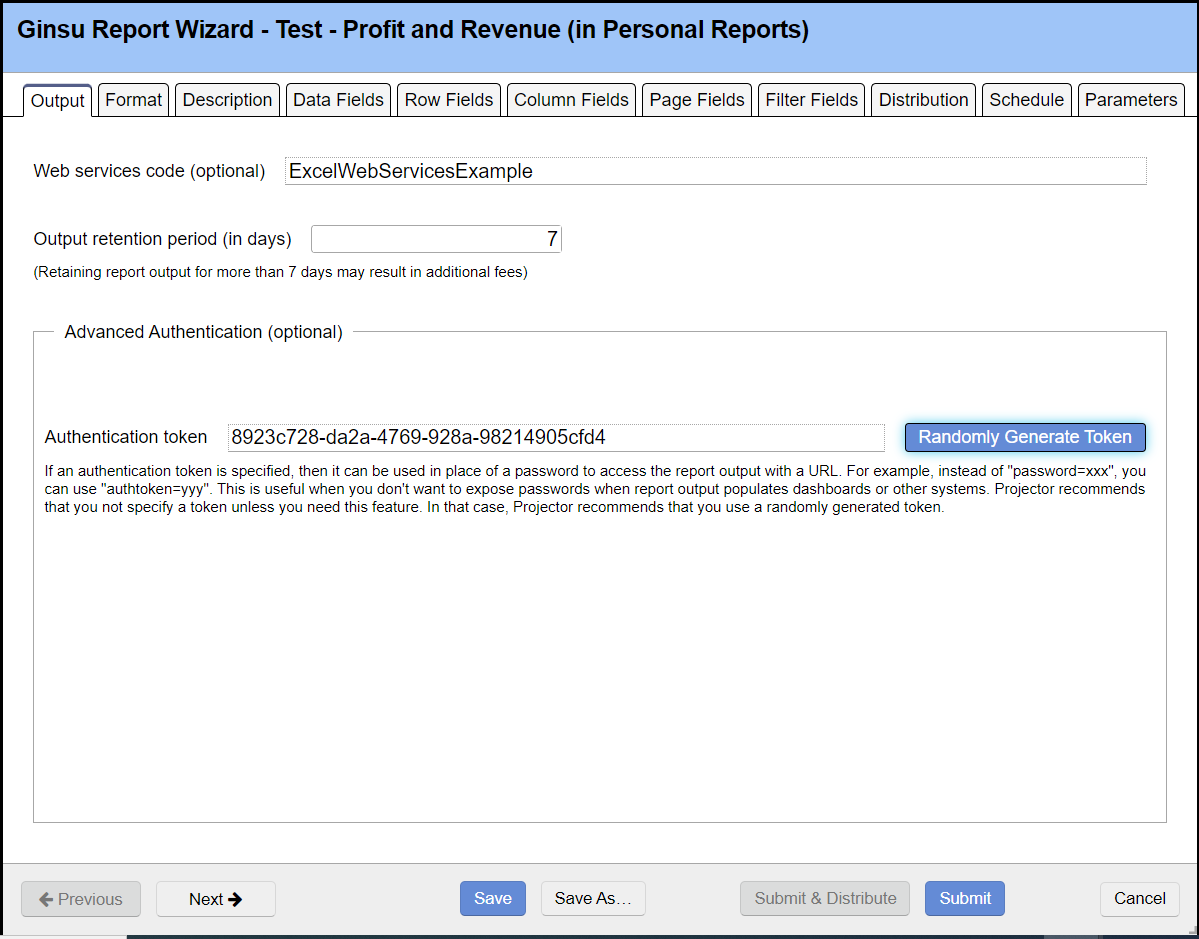
- Create or edit a report. On the Output tab set the following - Web service code and Auth token. If you don't see the auth token option, visit Account Settings Editor.
- Run the report
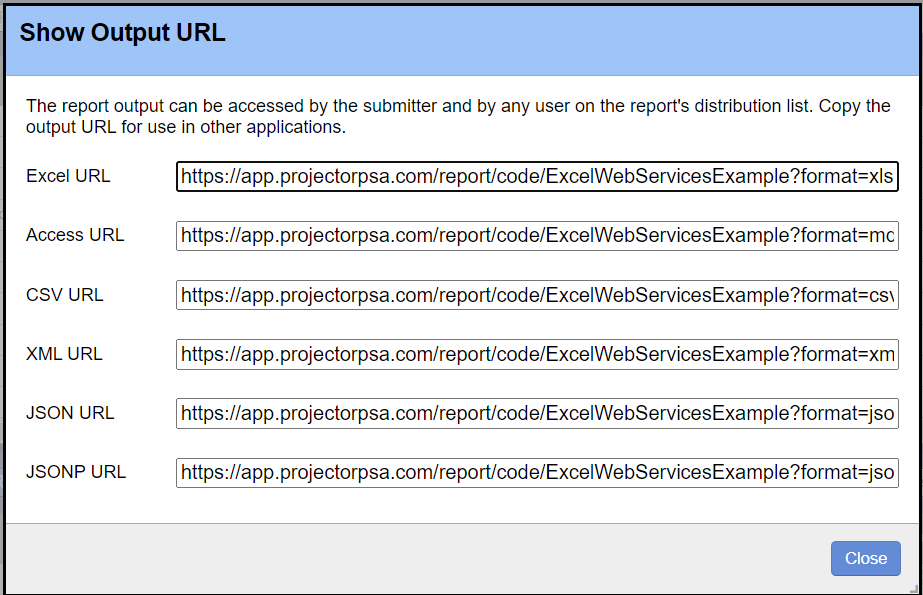
- Right click the report in the output area and choose Advanced | Show Output URL. Click Copy CSV URL.
Create Query from Web
Follow these steps to connect Power BI to the Projector report. This section assumes you have your CSV URL already.
- Open an Excel workbook
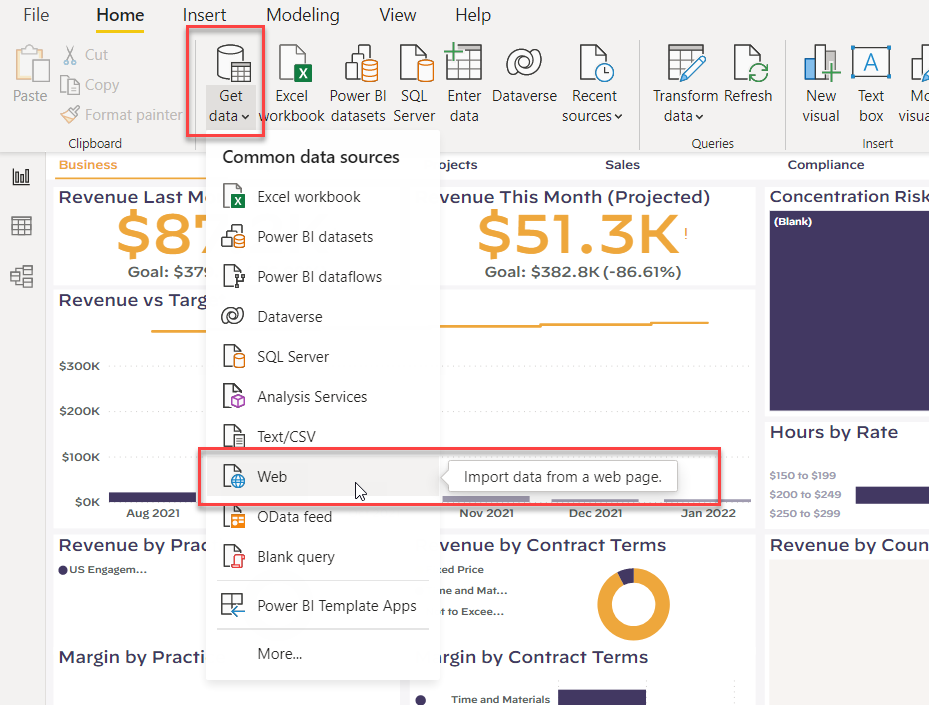
- Go to Home ribbon| Get data | Web dropdown
- Choose From Other Sources | From Web
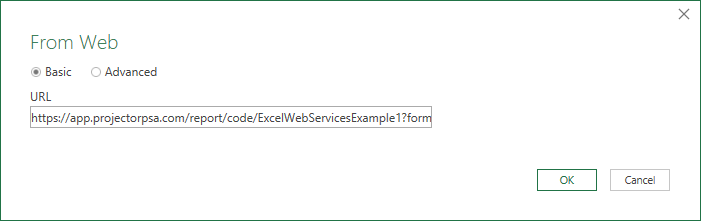
- Paste the URL into the From Web box. Click OK.
- Note: Some Projector report fields, such as rates and margin, are not included in the CSV output. The reason is that they can be calculated from other fields in the report. If you want all calculated fields included in the report output, add the following flag to your URL string:
- ExplicitFieldsOnly=yes
- ExplicitFieldsOnly=yes
- Note: Some Projector report fields, such as rates and margin, are not included in the CSV output. The reason is that they can be calculated from other fields in the report. If you want all calculated fields included in the report output, add the following flag to your URL string:
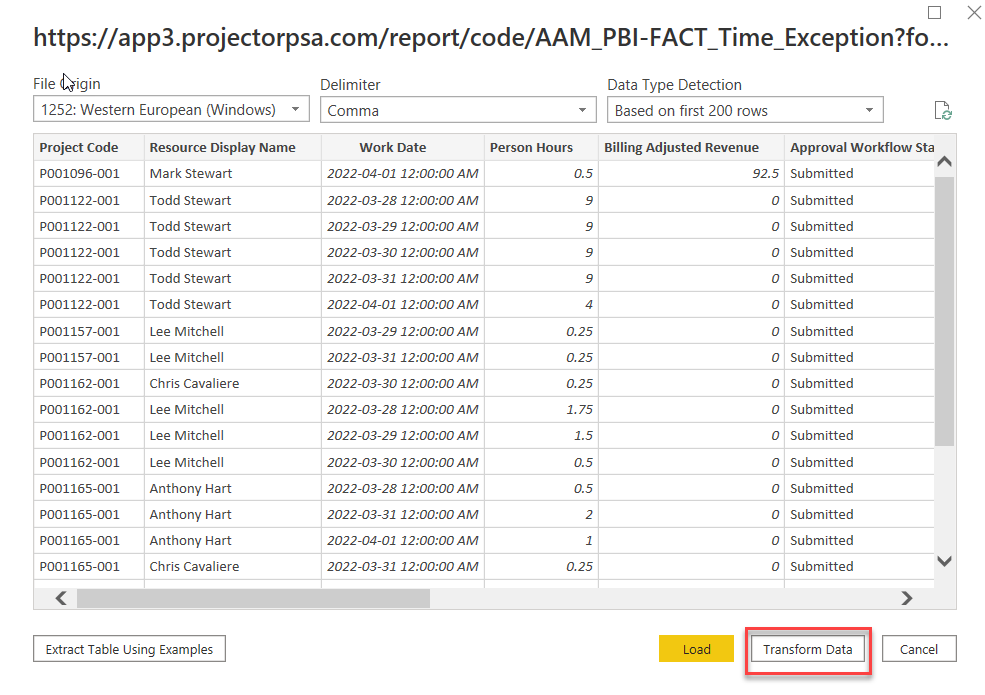
- Your data will preview in a popup window. Click Transform Data.
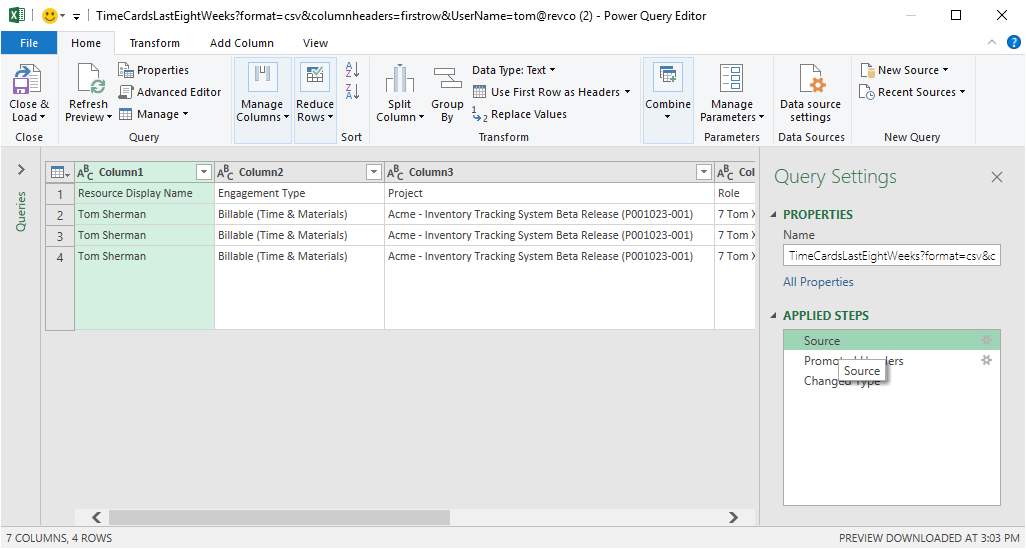
- The Transform editor will be displayed. Click the gear icon for Source under Applied Steps.
Set Line Breaks to Ignore quoted line breaks and click OK
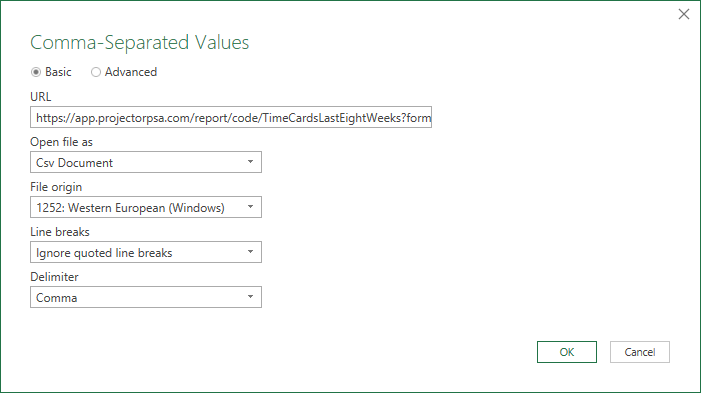
Why this step? Projector encloses any text field in double quotes. When that quoted field contains line breaks, we need Excel to treat it as a single entry and not try to create a new row of data.
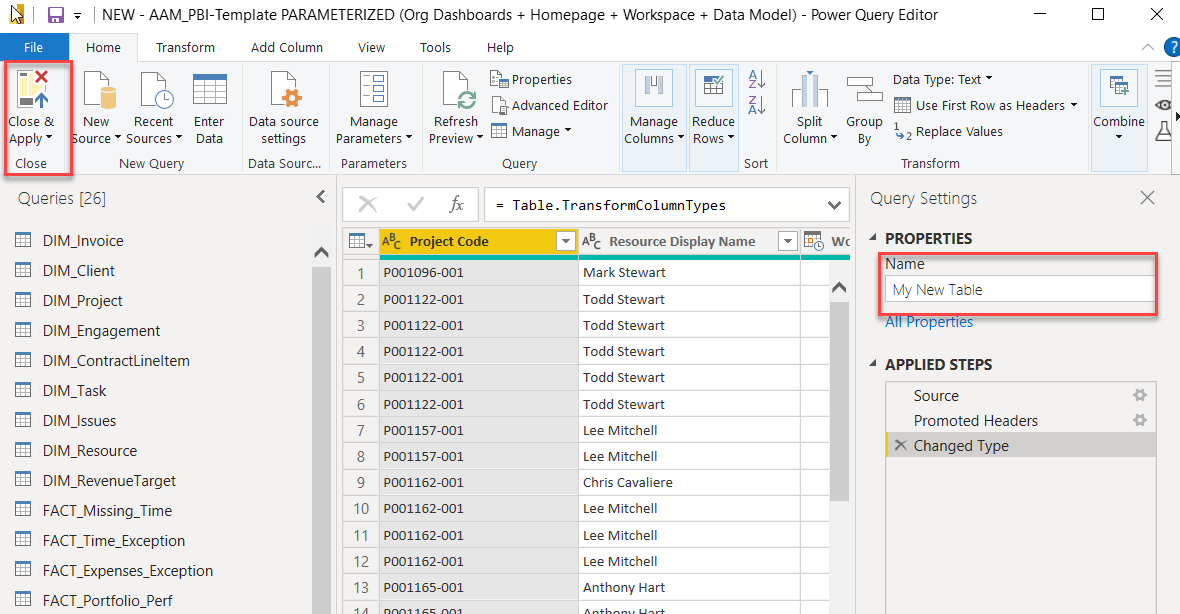
- Optionally modify the table name under Properties
- Click Close and Apply to load the table to your data model.
Refresh
You can schedule your Projector reports to run on a schedule and the Excel spreadsheet to refresh with the new data.
Manual
Two ways to manually update table.
- Right click on the table and choose Refresh
- From the Data menu | Connections ribbon section | Choose Refresh All
Automatic
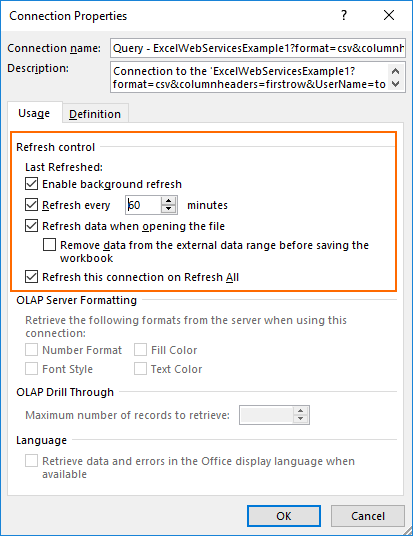
You can configure the connection to refresh on open of the Excel file or at set intervals.
- From the Data menu | Connections ribbon section | Choose Connections
- Select a connection and click Properties
- Set your refresh options
Add or Remove Columns
If you alter the Projector report by adding or removing columns, you should make sure you update your Excel spreadsheet too.
- If you are adding a column, make sure the column has already been added to your table in Excel
- From the Data menu | Get & Transform ribbon section | Choose Show Queries
- A sidebar appears with your queries
- Right click your query and choose Edit
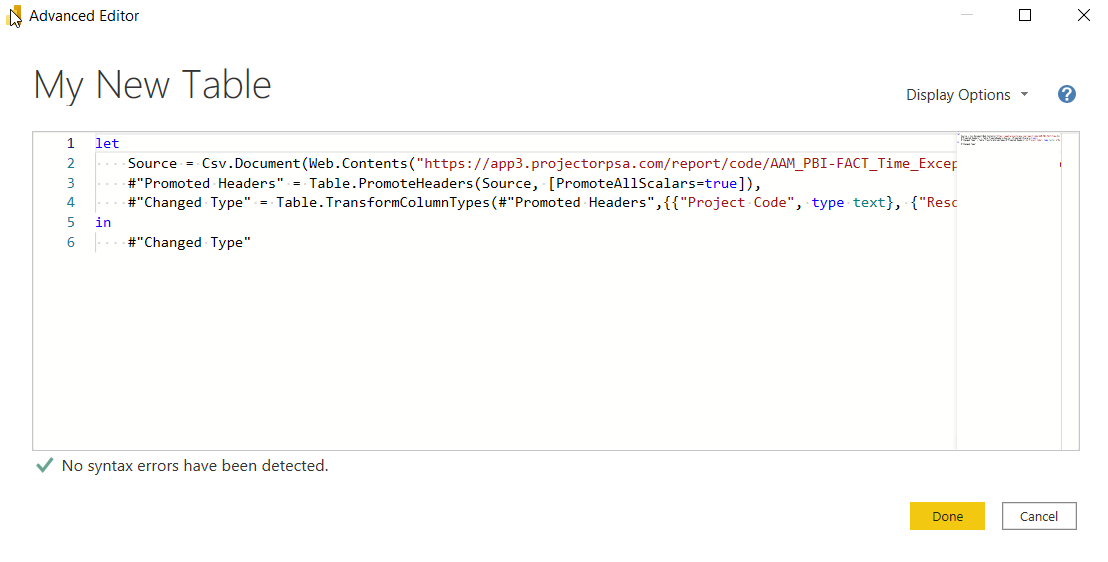
- Right click your query and choose Advanced Editor
On the second line, edit Columns and set the proper number of columns.
Source = Csv.Document(Web.Contents("https://app.projectorpsa.com/report/code/mycode?format=csv&UserName=tom@revcorp.tcs&AccountCode=revcorp-tcs&AuthToken=abc"),[Delimiter=",", Columns=6, Encoding=1252, QuoteStyle=QuoteStyle.None]),On the third line, edit to remove columns that will no longer be imported or add columns that will be imported. You may need to get the column name from the Projector report. Make sure you set the correct column type (text, datetime, Int64.Type, etc).
#"Changed Type" = Table.TransformColumnTypes(#"Promoted Headers",{{"Month", type datetime}, {"Engagement Code", type text}, {"Project Code", type text}, {"Resource Display Name", type text}, {"Person Hours", Int64.Type}, {"Data Type", type text}})Click Done
Click Close & Apply