Analyzing Profitability
- Former user (Deleted)
- Thomas Sherman (Deactivated)
- Shivam (Deactivated)
Additional Resources
1 Watch Projector Fundamentals: Measuring Profitability webinar for a deep dive into how Projector calculates Profitability.
2. In the webinar Incrementally Improving your Profitability with Projector, Phil Pedlikin, an executive responsible for selecting and adopting Projector at two different companies, discusses how he used the data and processes within Projector to dramatically improve the profitability of two organizations.
Profitability Analysis Overview
Profitability analysis allows managers to use the financial and scheduling data managed by Projector to analyze how profitable the ongoing operations of the organization are. One of Projector's major strengths is its analytical reporting capability that can be used to analyze profitability of cost centers, clients, engagements, projects, resources, locations, time periods, and many other factors. These analytical capabilities also allow many different kinds of profitability analyses. Two of the most useful analytical constructs that many companies utilize are rate realization and project profitability analyses. Several report templates that cover rate realization and profitability analyses are provided as pre-built public reports.
Rate Realization
Rate Realization Overview
Rate realization helps the company to identify what factors may have contributed to an organization's inability to realize its full stated earning potential. It also provides data often used by analysts to understand the financial viability of services organizations and to compare the health among multiple organizations.
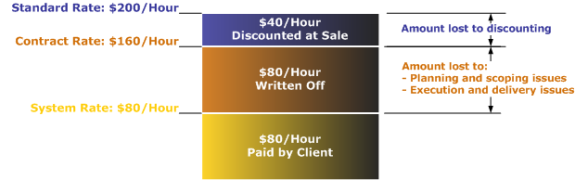
Rate realization builds upon the breakdown of rates discussed in the Key Concepts section into standard, contract, and system rates:
This analytical model entails comparing each the three types of rates amongst themselves. These comparisons can be described both in terms of:
- Rates – e.g., the difference between contract rates at which a project was sold and the cost center's standard rate card.
- Revenues – e.g., the difference between system and contract revenue for a particular engagement.
- Percentages – e.g., the contract rate divided by the standard rate, expressed as a percent.
Revenues and rates should be familiar from the discussion in the Key Concepts section. For consistency, percentages in the context of rate realization are generally expressed in terms of portions of the baseline measure as opposed to percentage differences. For instance, in the example above, if the standard rate was $200/hour and the project was sold at a contract rate of $160/hour, this relationship is expressed in Projector's reporting module as a Contract % of Standard equal to 80%, as opposed to a 20% discount.
Rate Realization Metrics
Projector's analytical reporting module utilizes three basic rate realization metrics to describe the relationships among the three types of rates:
- System % of Standard = System Rates or Revenue / Standard Rates or Revenue.
- Contract % of Standard = Contract Rates or Revenue / Standard Rates or Revenue.
- System % of Contract = System Rates or Revenue / Contract Rates or Revenue.
The set of metrics listed above uses system rates that do not incorporate other direct costs, which are expenses that are incurred during the course of delivering a project. These metrics can also be expressed taking these other direct costs into account as expenses may significantly impact the performance of certain organizations while being trivial for others.
System % of Standard
The first aspect of rate realization analysis is comparing system rates to standard rates. This difference describes how much the operations of the organization actually earned from its clients (system rates) as compared to what it theoretically could have earned (standard rates) had the clients been charged the current published non-discounted rates. System % of Standard does not try to identify what aspect of the organization, sales or delivery, had a larger impact on profitability. Rather, it provides a consolidated look at the organization's actual performance as compared to its theoretical current earning potential.
Note that since standard rates are derived from the current standard rate card of the engagement's cost center, and since organizations typically increase their rates over time, this difference between system and standard rates will tend to grow over time as well. Older projects will tend to have lower System % of Standard percentages than newer projects as market conditions inflate prices over time.
Contract % of Standard
Comparing contract to standard rates provides information on what discounting was done to sell the engagements at the outset. Contract % of Standard describes the difference between a resource's standard rate and reductions in that rate due to:
- Discounting – Giving clients a percentage discount off a rate card.
- Utilizing rate cards with lower rates – Utilizing a rate card that has lower rates than the current standard rate card.
- Utilizing title overrides – Charging a client the rate of a less expensive title than a resource's actual title.
- Utilizing rate overrides – Overriding Projector's title-based rates and charging a flat per-hour fee.
The Contract % of Standard figure will vary from organization to organization depending on the sales and marketing practices of the company. Some service organizations intentionally structure their rates higher than market norms and regularly discount their standard rates when selling business. Others make it a practice not to provide discounts and sell their business at their published rates.
Like the System % of Standard metric, Contract % of Standard uses standard rates as its baseline, so will tend to decrease over time as standard rates rise.
System % of Contract
System % of Contract compares the revenue that the organization actually generated from its clients (system rates) as compared to what it should have earned based on the initial client contract (contract rates). Because this metric uses in its numerator only revenue actually paid by clients and in its denominator amounts that a client would have paid, had they paid negotiated prices for every hour worked, it shows the effect of a host of issues:
- Write-downs
- Cost overruns on capped and fixed price projects
Most of the issues that are included in this metric relate to delivery problems and poor estimation. Generally, the System % Contract metric shows the effect of hours that are expended in the delivery of a project that the organization doesn't expect to be paid for. Both write-downs targeted at specific time cards and revenue recognition, which is spread across all timecards, will lower historical and projected system revenue and will thus affect System % Contract.
Metrics Including Other Direct Costs
In the two metrics described above that incorporate system revenue, system revenue after unreimbursed other direct costs can be substituted:
- System Revenue after ODC % of Standard = (System Revenue – Unreimbursed ODC ) / Standard Revenue
- System Revenue after ODC % of Contract = (System Revenue – Unreimbursed ODC ) / Contract Revenue
In addition, Projector's reports support a comparison of system revenue after unreimbursed ODC to system revenue:
- System Revenue after ODC % of System = (System Revenue – Unreimbursed ODC ) / System Revenue
When other direct costs are incorporated into rate realization metrics, only the unreimbursed portion is factored into the system revenue. For instance, if the organization is reimbursed $80 for a $100 expense, the system revenue is lowered by $20.
Using Projector to Conduct Rate Realization Analysis
Projector's powerful OLAP cube reporting engine provides a tremendous amount of flexibility to run rate realization analysis based on many different entities including cost centers, departments, locations, clients, engagements, projects, and resources. Each of these different types of analyses can be run for certain periods of time, for engagements unconstrained by time, or for trends over time.
Projector comes with engagement, engagement portfolio, and Ginsu Report rate realization reports and charts already defined in the Public Reports area, and users can create analyses for themselves.
Project Profitability
Project Profitability Overview
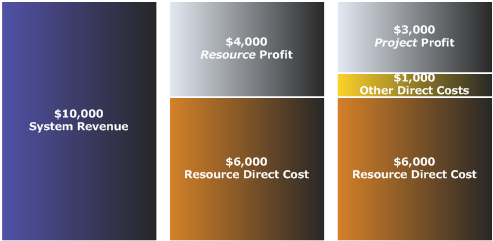
Project profitability analysis is the second major analytical construct that can be easily achieved using the information managed by Projector. This analysis compares the revenue generated by doing work for a client (system rates/revenue) to the cost to the organization of delivering those services (resource direct rates/cost plus other direct costs). While rate realization analysis concerns itself with comparing actual earnings with earning potential, project profitability is concerned only with comparing actual earnings with the cost of generating that revenue. As such, the concepts of standard and contract rates are not taken into account in project profitability analysis---only system rates, resource direct costs, and other direct costs:
Project profitability can be expressed in terms of:
- Profit – i.e., the amount of revenue left over after accounting for costs.
- Margin – i.e., the profit compared to the revenue, expressed as a percentage.
Note that project profitability analysis uses only hours actually expended when it calculates revenue and costs and does not take into account the overall utilization of those resources. For instance, a 100-person organization with a single project that keeps 10 people fully busy will have utilization of 10%. Project profitability for that single project may be excellent, but profitability for the organization as a whole may be poor. Because of this, organizations need to take resource utilization into account when correlating P&L profitability targets with project profitability data.
Project Profitability Metrics
Projector supports two methods of calculating profit and margin:
- Resource Profit/Margin – Profitability calculated by computing costs based only on resource direct costs.
- Project Profit/Margin – Profitability calculated by computing costs based on resource direct costs and other direct costs.
Resource Profit/Margin
Resource profit and resource margin are calculated as follows:
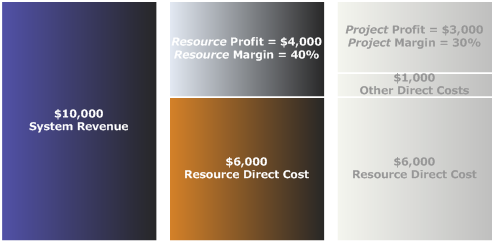
- Resource Profit = System Revenue – Resource Direct Cost.
- Resource Margin = (System Revenue – Resource Direct Cost) / System Revenue.
Resource profit/margin will be an adequate measure for many professional services organizations for which the largest cost components are resource costs and unreimbursed out-of-pocket expenditures are insignificant. Resource profit/margin may also be useful for organizations that do not make it a practice to forecast other direct costs and wish to examine forecasted profitability as compared to actual profitability.
Project Profit/Margin
Project profit and resource margin is calculated as follows:
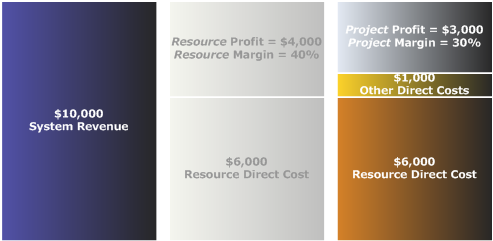
- Project Profit = System Revenue – Resource Direct Cost – Other Direct Costs.
- Project Margin = (System Revenue – Resource Direct Cost – Other Direct Costs) / System Revenue.
In the analysis of project profit/margin, only the portion(s) of other direct costs that have not been reimbursed are subtracted from system revenue. For many organizations, project profit/margin is a more accurate accounting of historical profitability since unreimbursed costs are factored into the equation along with resource direct costs. This is especially true in organizations for which other direct costs are significant as compared to resource costs, for instance, at companies that purchase advertising time on behalf of its clients. Organizations where other direct costs typically are not significant may also want to use this measure to ensure that if other direct costs do become a problem, it becomes apparent quickly.
Projector does not model reimbursed costs as system revenue, even if the reimbursed amount is higher than the cost.
Using Projector to Conduct Project Profitability Analysis
Both types of project profitability analyses can be accomplished through the use of Projector's analytical reporting capabilities. Users can run project and resource profit/margin analyses based on many different entities including cost centers, departments, locations, clients, engagements, projects, and resources. Each of these different types of analyses can be run for certain periods of time, for engagements unconstrained by time, or for trends over time.
Projector comes with engagement, engagement portfolio, and Ginsu project/resource profitability reports and charts already defined in the Public Reports area, and users can create analyses for themselves.
Whole Resource Profitability vs. Marginal Profitability
Overview
Projector provides two different ways to measure profitability when it comes to resource costs. Your relationship with the resource will dictate the best measurement tool. If you're responsible for managing whole resources (including their hiring, firing, utilization, etc.) it's recommended you use Whole Resource Profitability. On the other hand, people who "own" only a portion of a resource and are responsible for a project or a client are usually advised to use Marginal Profitability.
Whole Resource Profitability (for those who "own" whole resources)
Reporting Whole Resource Profitability can be accomplished by simply flagging "Use whole-day RDC" checkbox when running a profitability report. Whole-day RDC looks at the hours a person works and, if they are salaried, will spread the resource direct cost for that day across all the hours that person worked that day. This gives you a truer picture of profitability whether a resource works 4 hours or 16 hours in a day - you're paying them for a straight salary of 8 hours regardless. Of course, profitability will suffer if you can't manage to keep your resources utilized.
Marginal Profitability (for those who "own" a project or a client)
If whole-day RDC is not selected when running a profitability report, then Marginal Profitability is reported. Projector will simply calculate RDC as: RDC rate x hours worked. A project (or client) is "charged" for only the hours that you used...no more, no less. With this reporting methodology, if a resource isn't being kept utilized, that's not the PM's responsibility, and he/she doesn't get penalized for hours he/she doesn't use. The important thing here is that the PM also doesn't have the incentive to abuse people by working them more than 8 hours a day, which they might be tempted to do if they're able to generate more than 8 hours' revenue while getting charged only 8 hours of cost.
Also note the Whole Resource Profitability Report automatically uses whole-day RDC and does not give you any related selection checkbox.