Granting Access to Power BI Dashboards
This document outlines a number of common tasks and requirements around ProjectorBI. Particularly the steps to embed a report into Projector, how to add fields to Projector reports, or add entirely new reports to the dataset.
Grant Access to Users to View Visualizations
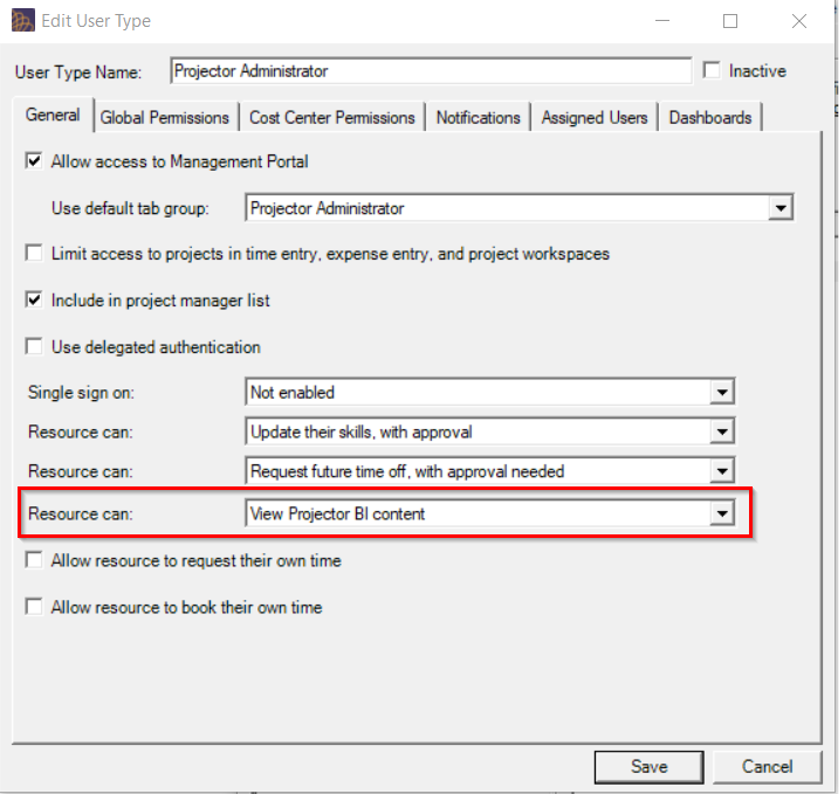
By "User Type" or "User", users must be explicitly configured to "View Projector BI content".
Options are:
- View Projector BI Content
- Not View Projector BI Content
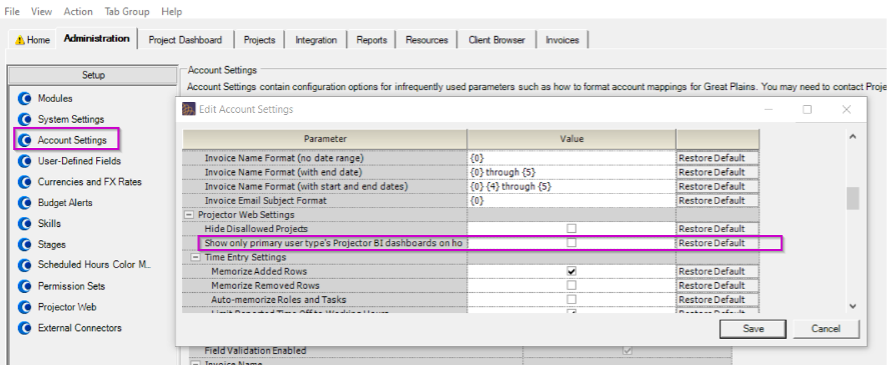
When Organization and Home Page dashboards are shared, they are shared by “user type”. This Account setting determines whether sharing is based only on the “primary user type” or based on all “user types”.
Publishing Dashboards
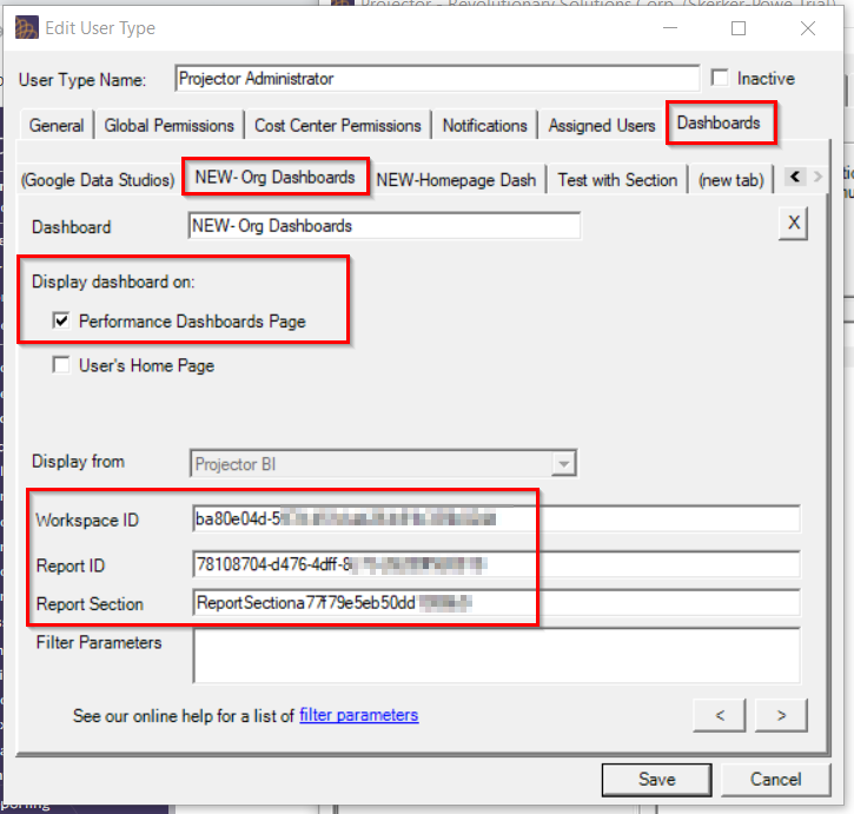
How to get the details for Workspace ID, Report ID and Report Section
Details for Workspace ID, Report ID and Report Section come from the URL in app.powerbi.com and get entered in Projector, along with any needed filter parameters.
- In Power BI Pro, open the workspace.
- Go to the URL and look for the string after /groups/…That is the workspace ID.
- Open each report individually. Each report will have its own report ID. It can be found in the URL right after /reports/… (Be careful to track them individually so that you can insert them into the proper menu for their intended purpose.)
As you navigate through each section (Business, People, Projects, etc) you will visit a report section. Each section has an individual identifier which can be found by going to the URL of the section that have selected, going to the
reportSection...".Copy and paste the details for Workspace ID, Report ID and Report Section in the appropriate fields in the User Type dialog in Projector.
- Note that the Business section only contains "ReportSection" with nothing after it. All others have a code after “ReportSection…”.
Example URL:
Dashboard Configurations
Example: Performance dashboard configuration
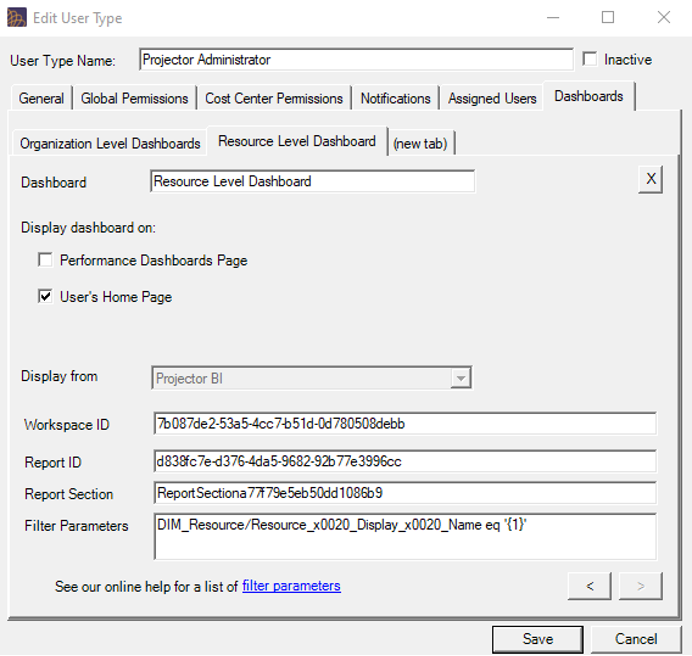
Example: Resource specific dashboard configuration
Filter: DIM_Resource/Resource_x0020_Display_x0020_Name eq '{1}'
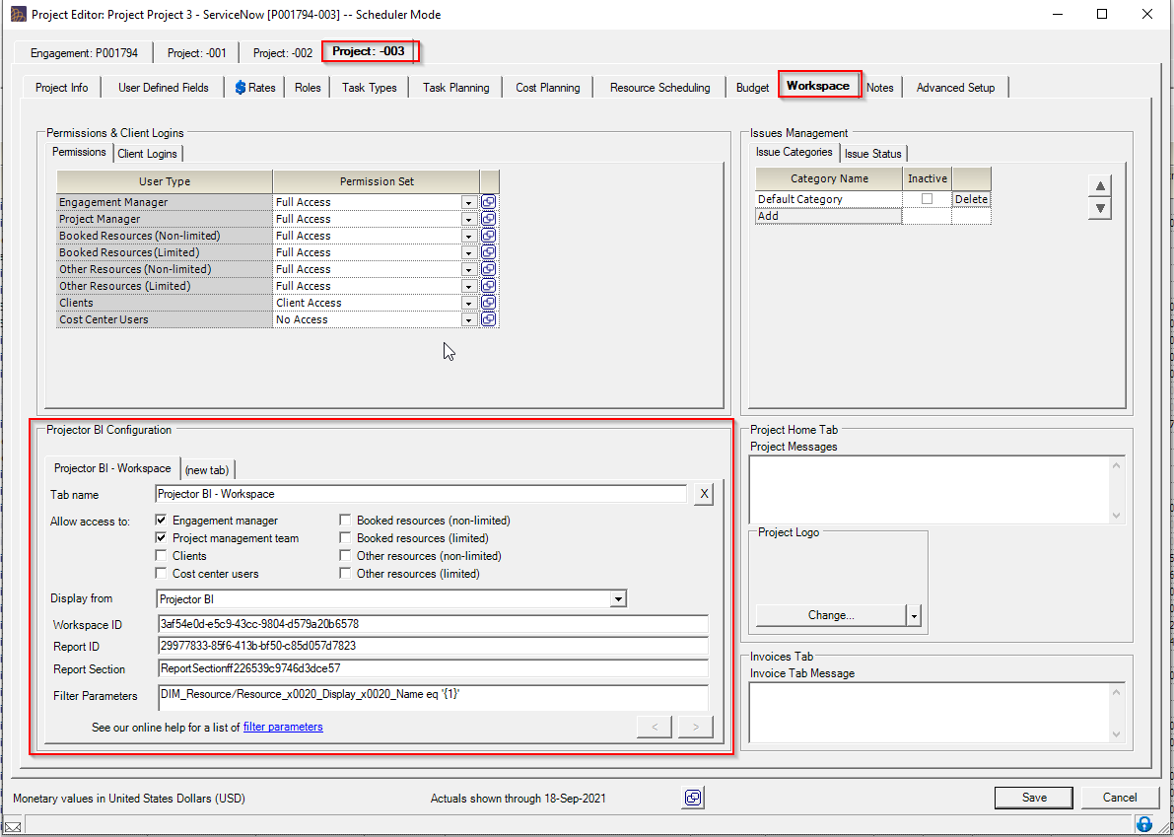
Workspace Dashboards can be Set up Either within the project on the Workspaces tab or by Engagement Type- (the UI is the same). The same UI allows you to set who has access based on their project role.
- Go to project
- Go to Workspace
- Go to Advanced Analytics Configuration
- Add a new tab
- Enter tab name
- Allow access as necessary
- Display from = MS Power BI
- Enter Workspace ID and Report ID
- Enter the ReportSection ID
- Set to filter by Project Code.
Example: Workspace dashboard configuration
Filter: DIM_Resource/Resource_x0020_Display_Name eq '{1}'
A Note on Filters
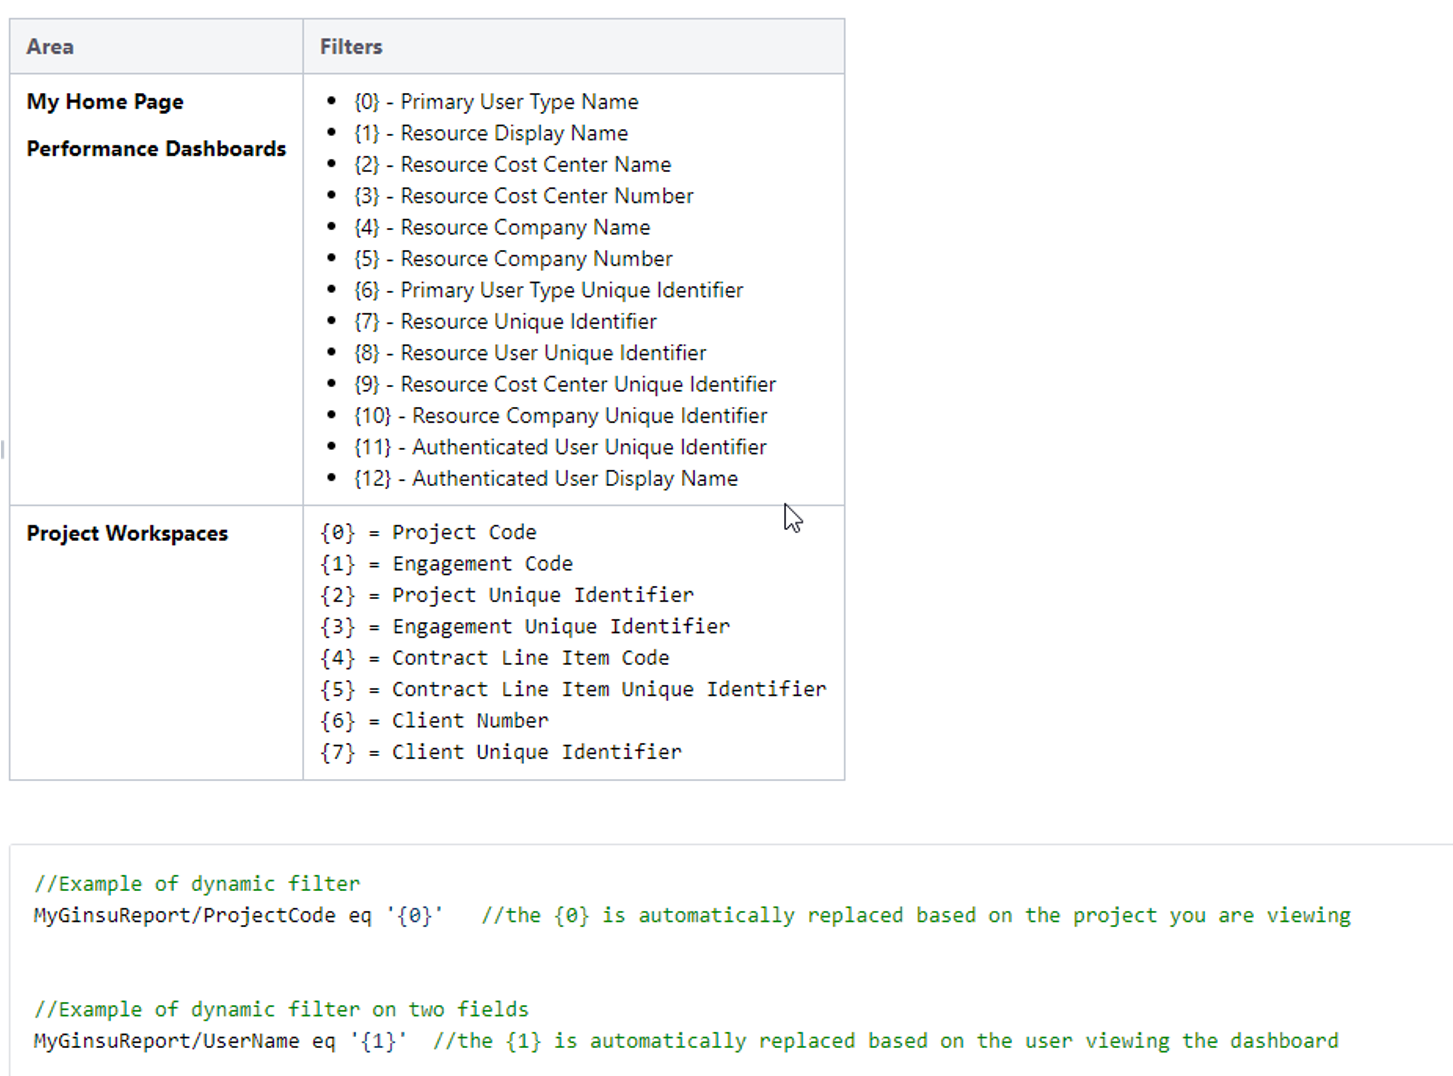
Dynamic Filters - You can dynamically filter the displayed content based on where it is displayed or who is viewing it. The table below explains the filters available.
Escaping Filters - Before you start actually building filters please note the following. If your Data Set or Field names contain spaces or non-ASCII characters they either need to be renamed or they need to be escaped. Renaming is easier to understand, so we recommend removing all spaces, hyphens, and special characters. If you choose to keep those kinds of character in the name, you'll need to escape them when building your filters. The most frequent character that needs escaping is a space.
To escape a character:
- Prepend '_x'
- Type Four-digit unicode character
- Append underscore '_'
For example, a space becomes _x0020_. The field 'Project Code' would become 'Project_x0020_Code'.
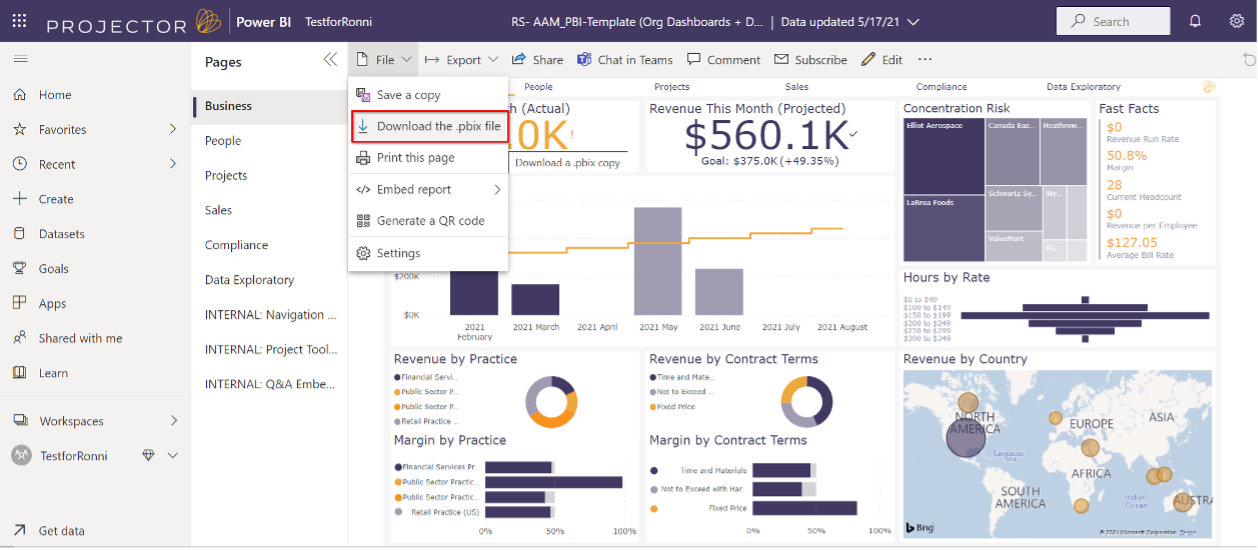
To Download the .pbix File from the Power BI Workspace for Editing
From within the power BI report in the workspace, choose the option to download the pbix file.
This message indicates that the file is being downloaded:
Once downloaded, the file can be modified in Power BI desktop. It’s important to keep the file name the same (for re-uploading), but Projector recommends keeping dated backup copies to ensure that the latest version is uploaded to the workspace.
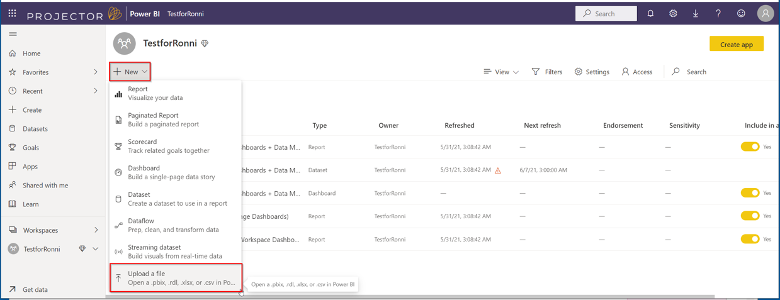
To Upload the pbix file to the Power BI Workspace
From the workspace main page, choose the option to “Upload a File”.
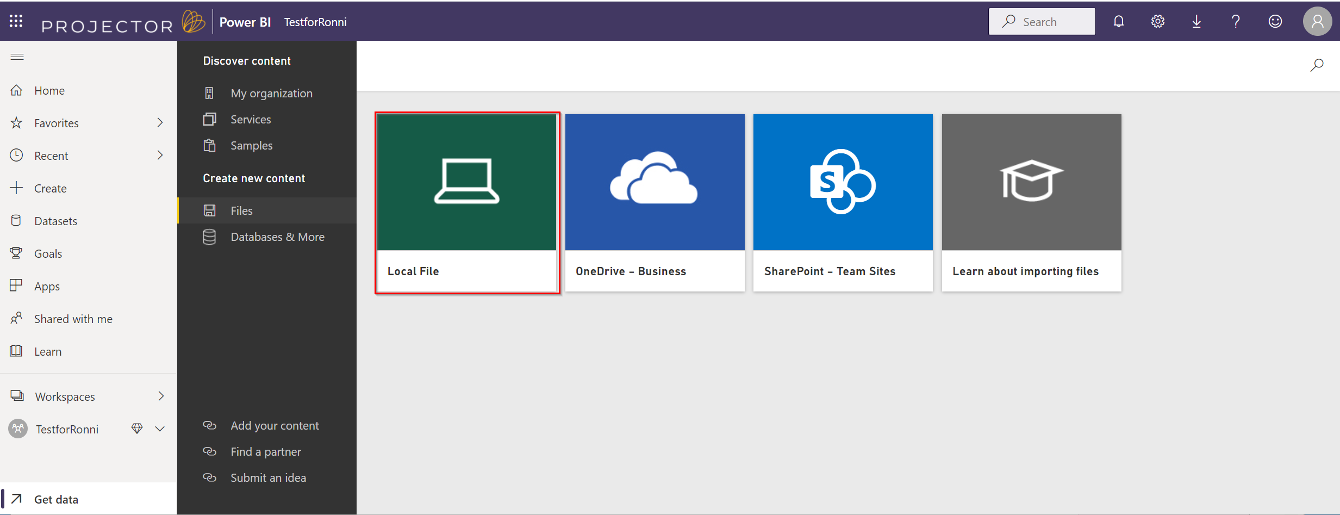
Since the file is stored locally, choose this option:
Select the file and make sure to keep the same file name, so that the file is replaced and not added.
You will get this warning message:
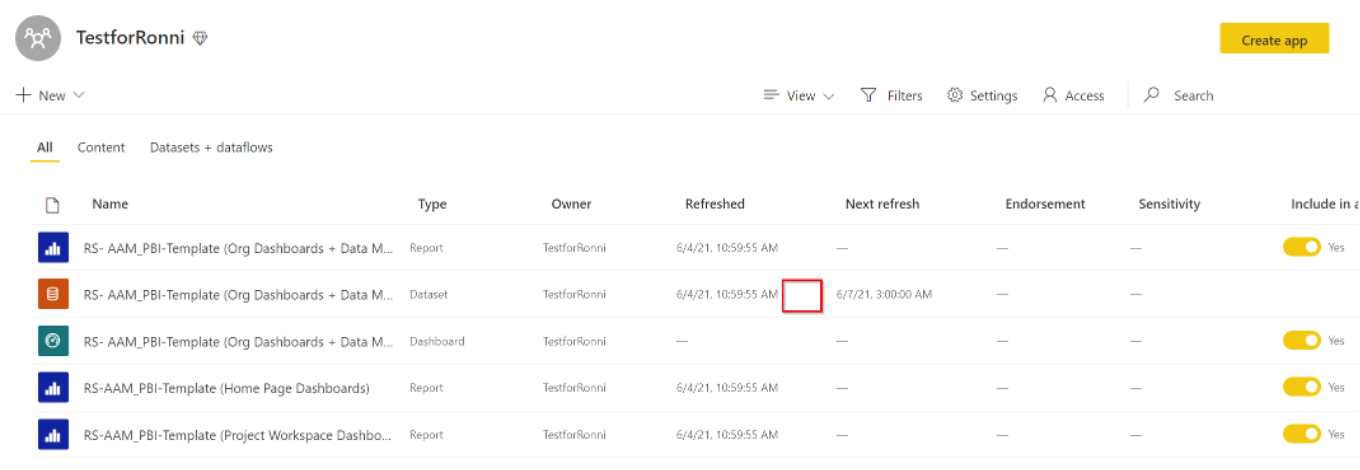
Once the file is uploaded, the data will attempt to refresh. Be sure to check that the refresh was successful. If there is an error with the refresh, it will appear as an icon here (indicated in the red box region).
Adding Fields to ProjectorBI Datasets
You may find you need additional fields in your ProjectorBI environment. To do so you’ll first need to add them to the underlying Projector Reports.
Do this from the Projector reporting interface. You’ll need to sign in as whatever user owns the scheduled reports. PPSA recommends this be a generic user.
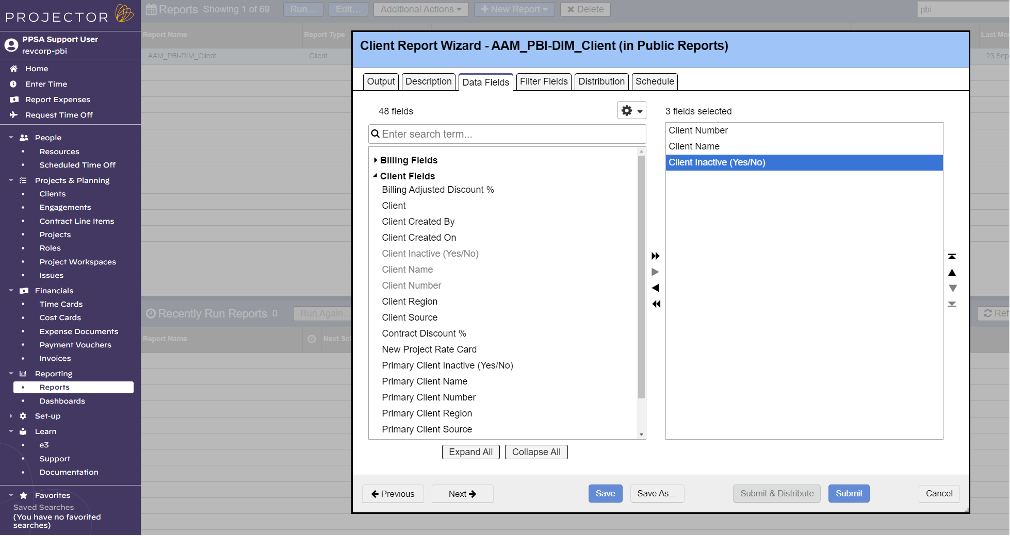
Open the report that needs additional fields and add the fields:
The trick here is to remember how many fields you added. In this case I added one field.
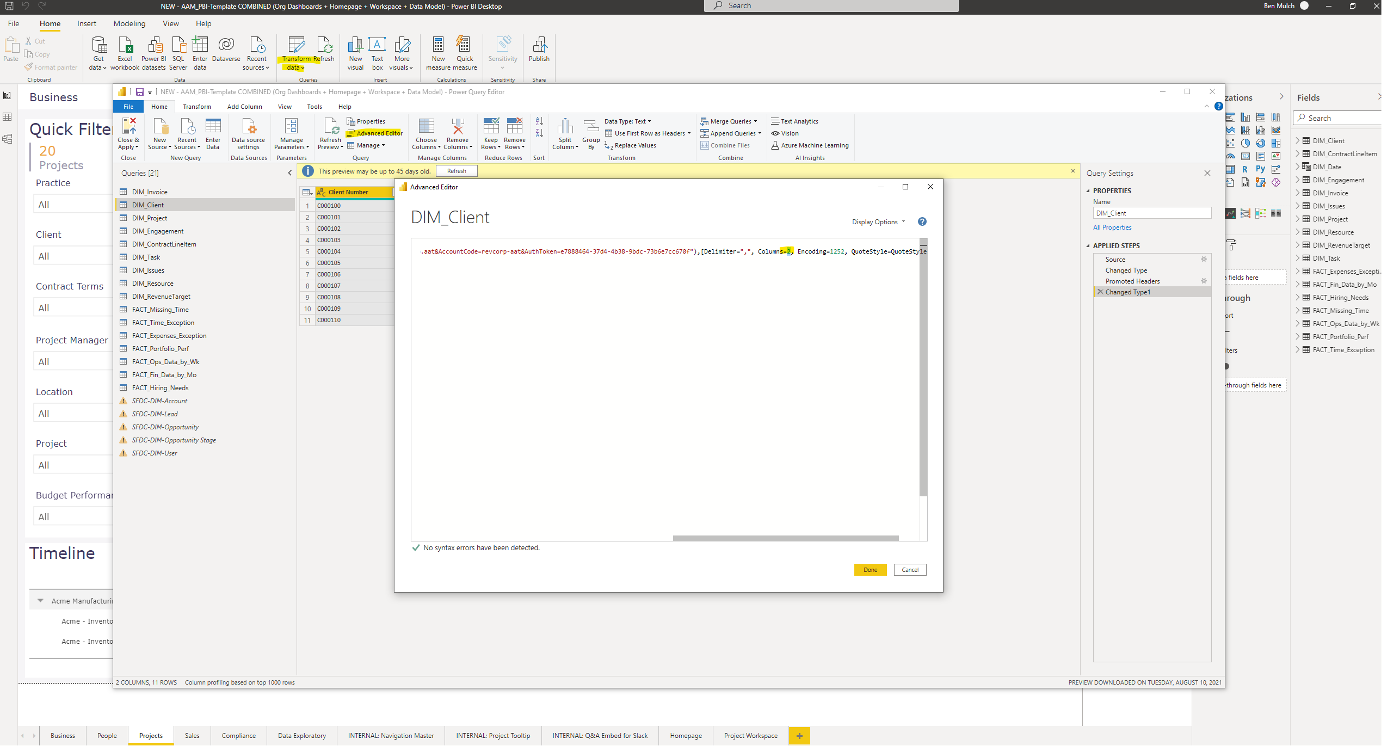
Now go to PBI Desktop and Transform the data. Transform will open Power Query. Select your query or dataset and select Advanced Editor.
From the Advanced Editor you need to tell PBI to expect additional columns. Overwrite the hardcoded column count here by adding the fields you’ve just added with the existing fields. In this case my query has gone from 2 columns to 3 columns.
Save and Apply your changes. This method can be used to add data fields or row fields to any Projector report.
Adding Additional Reports to ProjectorBI
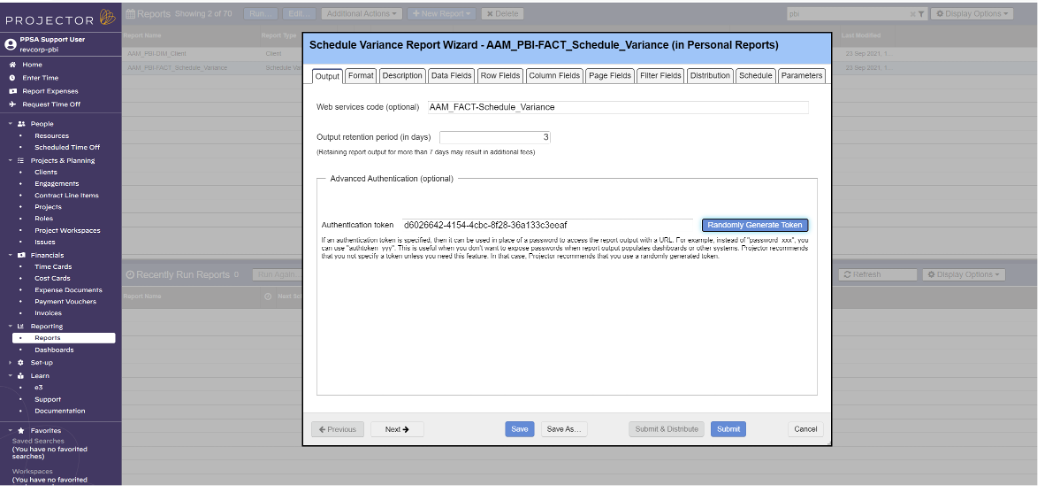
You may also find that you need entirely new reports added to your dataset. To do this create the new report in Projector:
Be sure to give the report a useful name and copy the authentication token from the other reports. You’ll also want to set up a schedule for this report that makes sense with your other ProjectorBI reports.
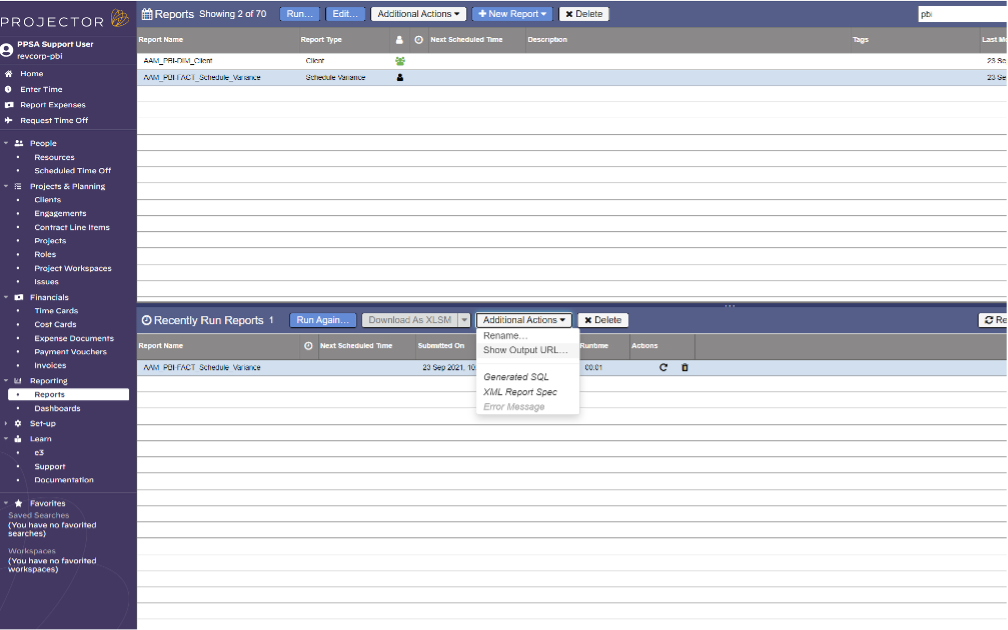
Once your is ready submit the report. On the completed report select “Show Output URL…”.
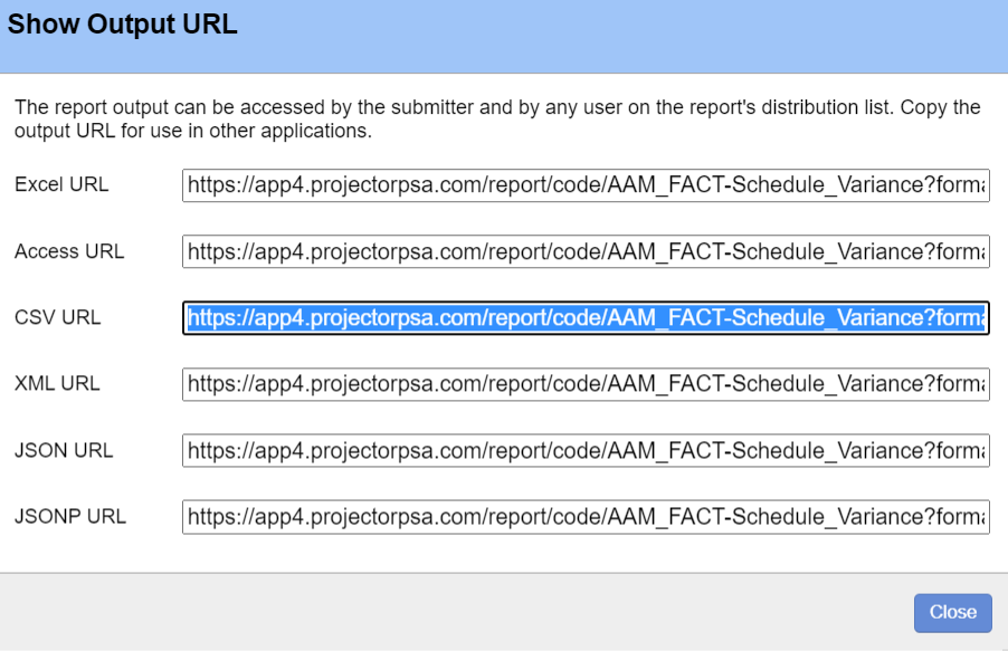
From here copy the csv output url. This is the url that will point PowerBI to Projector’s web services to retrieve the report.
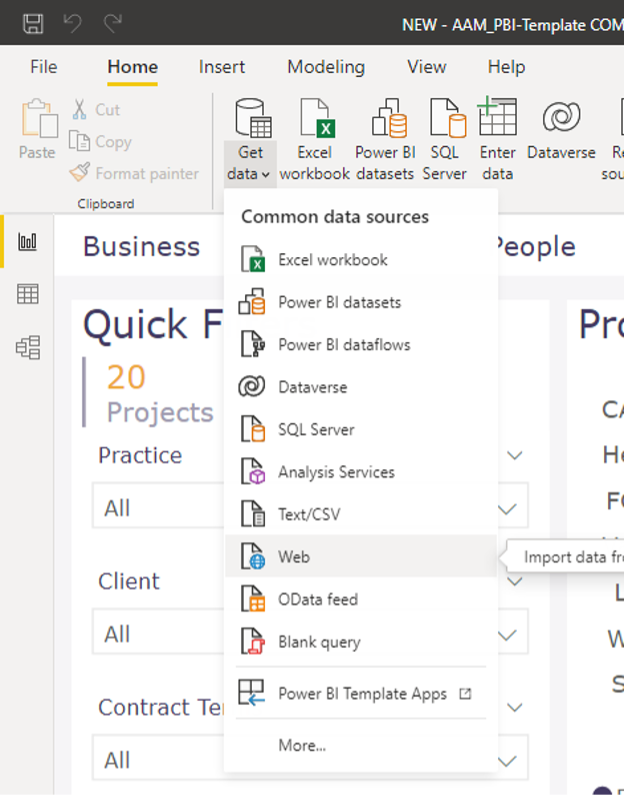
Now in your PBI Desktop file select “Get Data” > “Web”:
Drop the CSV URL in the following popup. Add the suffix "&IncludeEmpty=yes" to any reports that could hypothetically come back empty.
PowerBI will show you a sample of your data. From here you’ll likely want to “Transform Data” to finish building out this dataset.
Common Troubleshooting
Commas in Project Descriptions
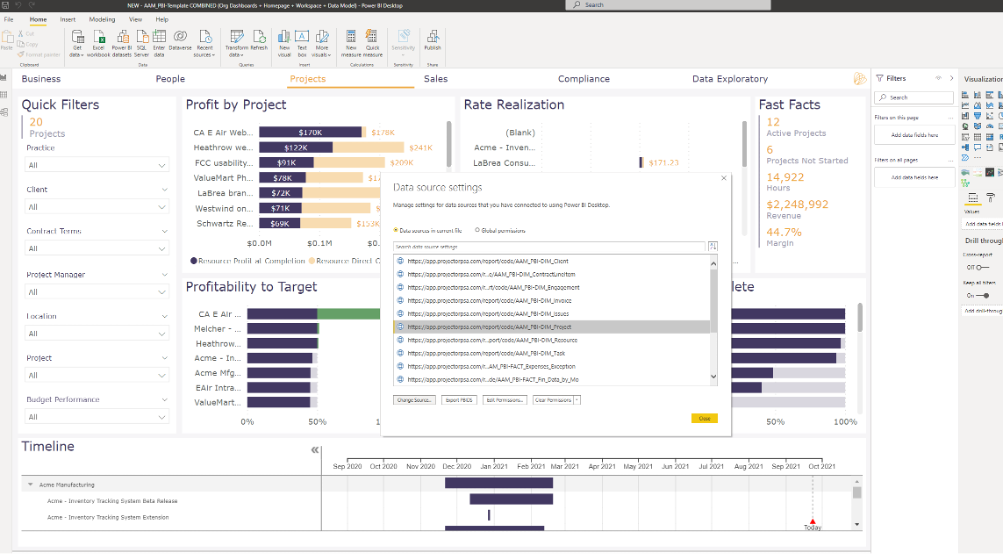
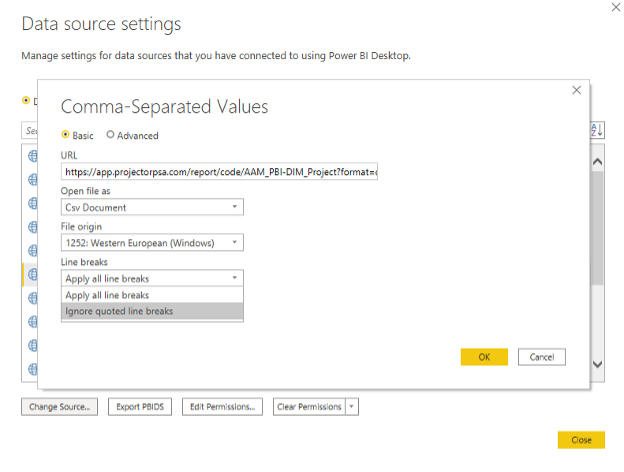
Sometimes a report will break because of duplicates in an unexpected data set (generally DIM_Project). This is caused by comma’s in the Project Description field. The simple fix here is to open the Data Source Settings, navigate to your report, and select “Change Source”:
In the setting change the “Line Breaks” drop down to “Ignore quoted line breaks”.
Save and apply.
