...
| Tip | ||
|---|---|---|
| ||
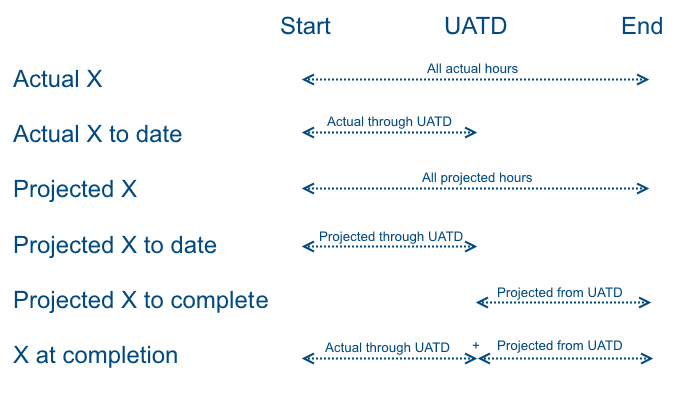
The PPR report contains hundreds of fields, and keeping track of them can be difficult. This section helps you get a handle on what each field means. The first thing to understand is that many of the fields have similar names . The reason is because we using a but follow simple naming schema. By understanding the schema, you can quickly narrow down the fields you are actually interested in. There are six fields in the schema. Simply substitute in the metric you are looking for (revenue, hours, etc).
So what do each of these actually mean? They differ based on the date ranges that they cover. You'll see three distinct ranges.
The graphic below helps visualize them. See below the image for some real world examples of using them. ("UATD" stands for "Use Actuals Through Date")
So why do we have all the fields and why would you choose one over another? I think the best example is when you want to look at the difference between what work was expected and what work was actually done. This is what our variance report shows. For example, you might use -
|
...