...
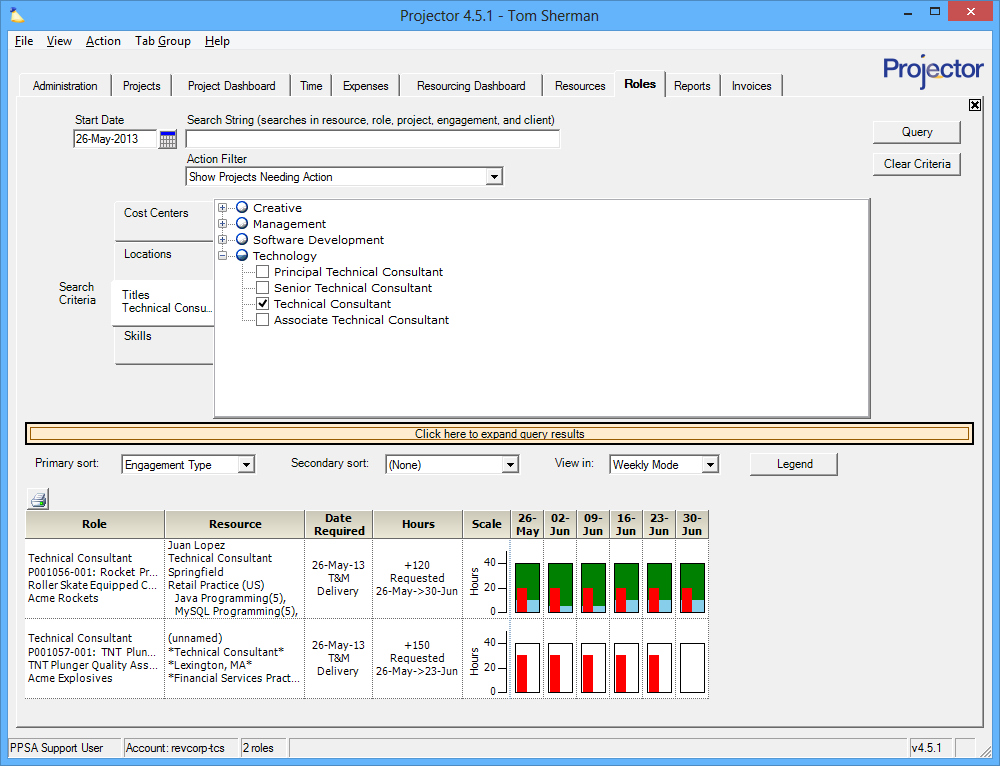
This tab is reached by choosing View Menu | Scheduling | Roles.
Permissions and Settings
...
| Tip | ||
|---|---|---|
| ||
Open multiple resource browsers at once, and the query criteria for each will be saved so that they are available each time you login to Projector. This is useful if you have a few different types of resource searches that you normally use. |
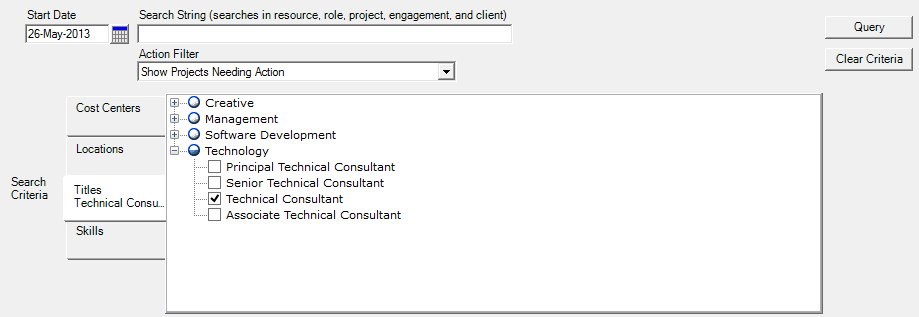
Fill in the search criteria based on what you are looking to do. The table below explains each of the search tools Projector provides. After the table we provide some example searches.
| Search Filter | Description |
|---|---|
| Start Date | Only show roles that have requests or bookings from the start date onward |
| Search String | Search all of the following fields. You can specify complex search criteria.
|
| Action Filter | Filters out roles on any project according to the following criteria:
|
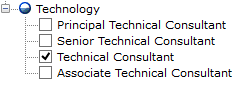
| Search Criteria | The search criteria section has four subsections, Cost Centers, Locations, Titles, and Skills. You can use this to narrow down the roles that you are interested in. Clear the checkboxes completely to display all roles. Tick the checkboxes to only show the selected roles. For instance, I know I need a consultant in Lexington. So search on all Consultant titles in the Lexington location.
|
If you need to modify your query, click the pink colored bar named Click here to expand query results

Example Queries
...
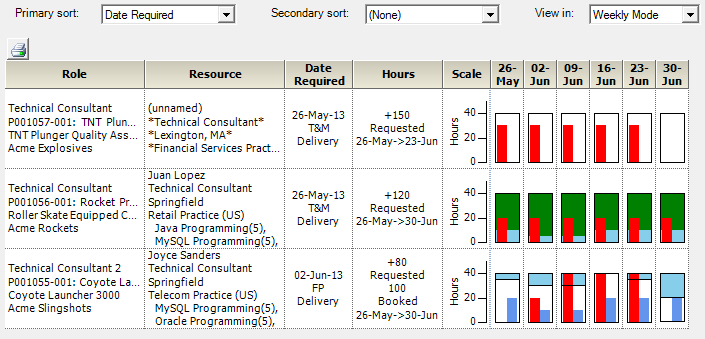
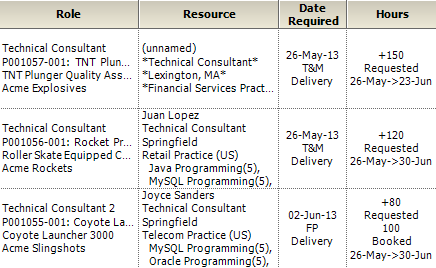
Once you have specified your search, click Query to display the results. The upper section collapses and the results are shown below in a six column grid. Each role has its own row. In the screenshot below I searched for Technical Consultants and three were returned.
Bar Graph Columns
...
At the most basic level, a white rectangle is shown. The rectangle represents the normal working hours for this role. The white rectangle then fills in with information as hours are requested and booked.

Requested hours for this role are shown as a red bar. In the screenshot below about thirty hours have been requested.

Booked hours for this role are shown as a blue bar. Here we see there are 20 booked hours.

If you have both requested and booked hours, the graph shows both. If you booked the requested hours, the red bar would move on top of the blue bar.

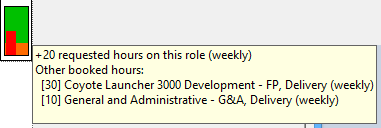
This last bit can be a little confusing, but it serves a useful purpose once you understand how it works. Booked hours on other projects fill in the white rectangle from the top. These bars may be multi-colored like in the screenshots below.
 10 hours
 22 hours
hours
 40 hours (fully booked now)
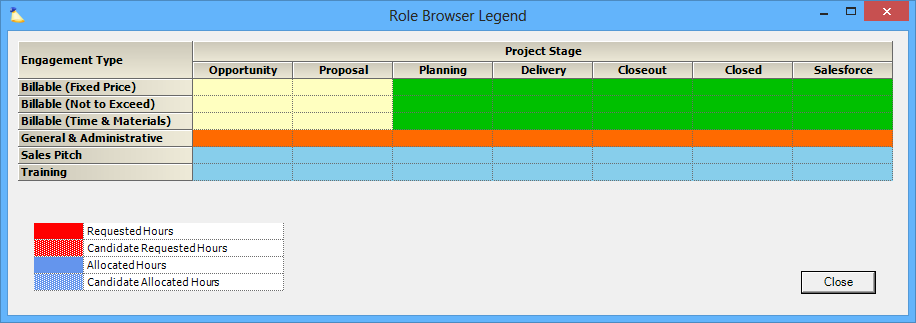
So where do these colors come from and what do they mean? The bars represent the type of engagement and the engagement's current stage. The color displayed depends on your installation's setting. To see a legend of the colors map, click the Legend button. Looking at the screenshot below, you can see that orange maps to General & Administrative projects.
So why are these bars coming down from the top instead of up from the bottom? Well, when the bar coming down intersects the bar coming up, you know the resource is overallocated.
 See that white gap? This resource has availability!
 No gap? This resource is all tied up!
Overlapping
 Overlapping? This resource is swamped! Notice how Projector outlines the area in red to show the overallocation.
...
- Current Requested
- Current Booked
- Booked hours on other projects and which projects they are
Right mouse button on any graph to gain quick access to scheduling on other projects. Pick the project from the list and it jumps to the resource scheduling tab.

Other Columns
Now that you understand how the bar graphs work, let's look at the rest of the columns in the grid. Each is explained in the table below.
| Column | Description |
|---|---|
| Role | Displays the following information:
|
| Resource | Displays the following information:
|
| Date Required | Displays the following information:
|
| Hours | Displays the following information:
|
...