Utilization Basis Hours, Yield and Capacity
Additional Resources
The Topic of the Day: Utilization webinar is a great resource to learn about managing and measuring resource utilization with Projector. (go to 14:21)
Utilization Basis Hours
One of the key ideas of a utilization report is called Utilization Basis Hours (UBH). UBH is a fancy way of saying these are the number of hours I expect my employees to work. So if an employee has a 40 hour work-week then their UBH would be 40. Things like holidays and time off can affect this number. Once you know how many hours you expect your resources to work you can start calculating how effectively they are utilized. For example if a resource worked 20 hours for a 40 hour work week then you know they were only half used. See the Permissions and Settings section below to learn more about how your UBH is calculated.
Full Time Equivalents
Full Time Equivalents (FTE's) are a unique concept to utilization reports. FTE is a means of measuring on a person basis as opposed to an hours basis. To learn more about FTE's and how they can help your organization please see the Measuring Utilization how-to.
Yield vs. Capacity
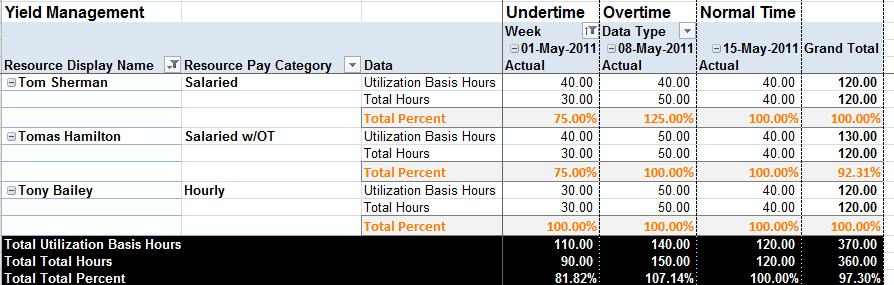
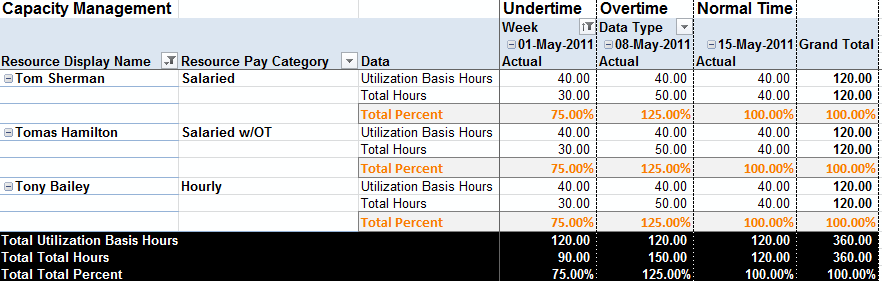
Another key idea of utilization reports is the calculation method, Yield or Capacity. If you are running a report it is very important to understand which of the two you are using and why. Yield shows you how much you are getting out of your workforce compared to what you pay them. Capacity shows you how much you are getting out of your workforce compared to what they can do. The simplest comparison between the two is someone you reimburse hourly. An hourly person only gets paid when they work. So their yield is always 100%. Doesn't matter if they work zero hours, one hour, or a hundred hours in a week. Capacity shows how much you are getting vs. what they could be doing. If that hourly employee only works one hour, then there are 39 more hours in the week they could have worked. They are 1/40 utilized. The two methods answer very different questions.
The chart below explains these two concepts.
Calculation Method | Description |
|---|---|
Yield Management | How much work are you getting out of your delivery organization as compared to what you are paying for? If a user worked many hours, but generated very little revenue then they have a low yield. The calculation is based upon how resources are compensated.
|
Capacity Management | How much work are you getting out of your delivery organization as compared to what the full potential is? If you have many employees who are available, but not working, then you are running under capacity.
|