| Excerpt | ||
|---|---|---|
| ||
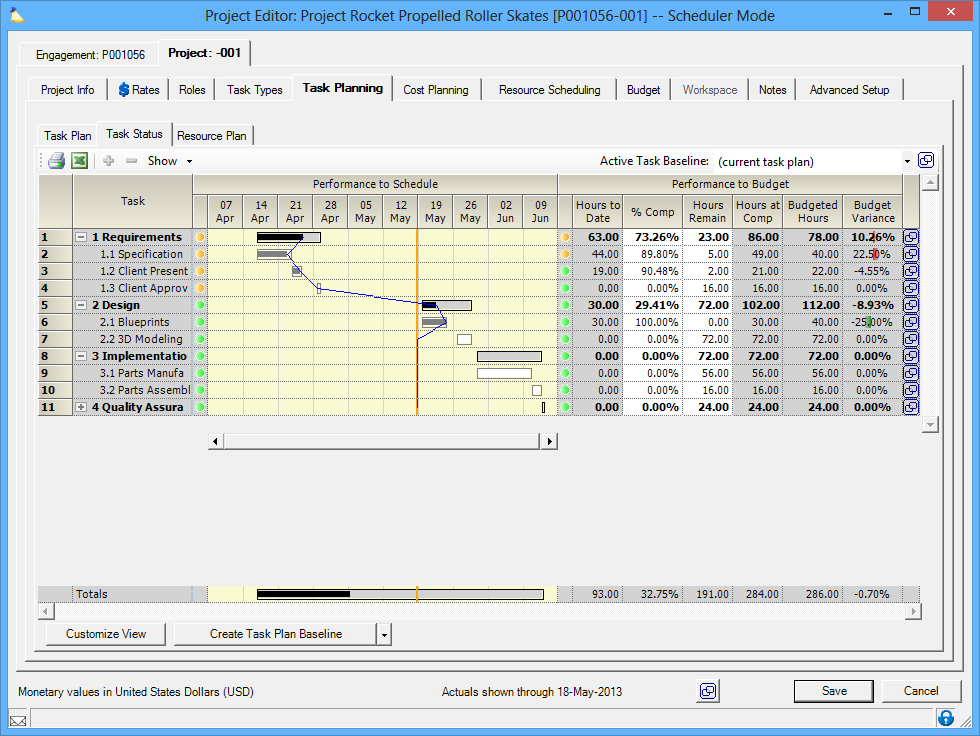
visualize your project's performance to schedule and performance to budget |
...
| Tip | ||
|---|---|---|
| ||
|
This tab is reach from the Task Planning tab of the Project Editor.

Permissions and Settings
...
The task status tab is all about visualizing your projects performance to your plan. But plans change over time. What version of the plan am I looking at? The answer is in baselines. A baseline is a snapshot in time of your plan. As you modify your task plan, perhaps by allocating additional resources to late tasks or by pushing a task out to a later date, you should create new baselines. You can then switch between the baselines from the dropdown box in the upper right. This updates the visualizations you see. If you are only interested in the most current version of your plan, then set the dropdown to current task plan.
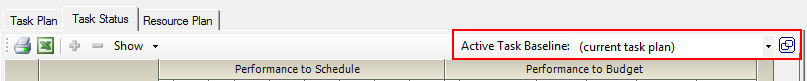

To create additional baselines, click the Create Task Plan Baseline button from the multi-select dropdown box. Learn about baseline creation from our article Create a Task Plan Baseline.
...
When a task is late Projector will inform both project managers through the project editor and resources through time entry. In the project editor a yellow circle (
 ) is shown for each late task. In time entry a late badge (
 ) is shown.
...
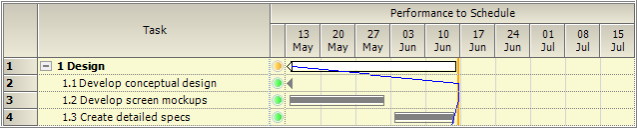
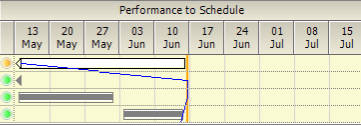
The Performance to Schedule display provides a Gantt chart of your task plan. The Gantt chart displays a graphical representation of a task's status against its schedule. This section will explain each of the unique graphical elements that Projector utilizes to convey performance information.

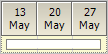
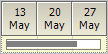
Orange Column - Use Actuals Through Date
The use actuals through date is displayed as a vertical orange bar. All data to the left of the line are actuals, while the data displayed to the right of the line are projections.

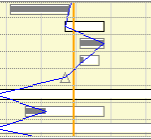
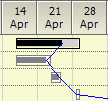
White Bar - Task Duration
Each task is graphically represented by a white box that stretches horizontally across time. The box begins at the Planned Start Date and ends on the Planned End Date. For an explanation of start and end dates see the Task Plan Tab.
Gray Bar - Task Percent Complete
As each task is completed, it fills in with gray. You can see from the bar below that the task is about 80% complete.
Black Bar - Parent Percent Complete
Parent tasks fill in with black instead of gray, but serve the same purpose as gray bars - to show the percent complete. Black bars represent a roll up of child task completion.

Blue Line - Progress Line
The blue line travels from task to task - connecting imaginary dots at the end of each gray or black bar. By comparing the blue line to the orange line you can visualize how close you are to your schedule. If the blue line leads the orange line, then you are ahead of schedule. If the blue line lags the orange line then you are falling behind.

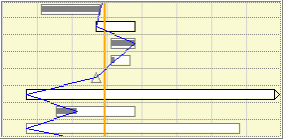
Arrows
An arrow is shown 


 if a task does not fit in the current date range. Scroll to the right/left to view these tasks in the past/future. The arrows gradually darken from white to black as tasks go from incomplete to complete.


Green and Yellow Circles
Projector provides an additional performance indicator in the form of a color code. Projects that are on or ahead of schedule display a green circle (
 ). Projects that are behind schedule display a yellow circle (). See the Late Tasks section of this page for more information on yellow circles.
...
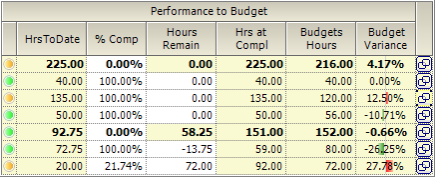
Performance to Budget presents numerical data on the status of a task. The table below explains each column.

| Column | Description |
|---|---|
Bullet | The bullet turns yellow when a task is over budget. A task is over budget when hours at completion are greater than the budgeted hours. |
| HrsToDate | The number of hours approved against this task |
| % Comp | How complete is this task? The percent is auto-calculated based on the number of reported hours, but resources can override the percent complete manually through Enter Time. For example, if ten hours have been approved for a twenty hour task, it is 50% complete. However, the resource has the option to step in and say the task is actually 75% done. |
| Hours Remain | The number of hours required to complete the task. This number is derived from approved hours to date and percent complete. For example, if you have worked 10 hours and are 50% complete, you have 10 hours left. |
| Hrs at Compl | For completed tasks this is just the number of hours spent. For in progress tasks it is the estimated hours required that will have been spent by the time the task completes. |
| Budgets Hours | The quantity of hours budgeted for this task, as determined by the Task Plan. |
Budget Variance | The percent of variance between the budgeted hours and estimate to complete hours. Projector displays a shader bar in red/green so that you can visualize how over or under budget a task is. |


...
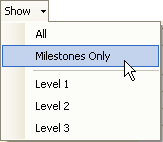
Click on the Show button in the toolbar to quickly filter on task levels or types.

| Choice | Filter Type |
|---|---|
| All | Displays all tasks |
| Milestones Only | See Task Plan Tab for the definition of a milestone task |
| Levels 1 to N | All tasks below that level will be collapsed. Useful for filtering the plan from granular detail to larger concepts. |
...
| Control | Description |
|---|---|
| Active Baseline | This is just another access point to the same dropdown in the main Task Status window. It is not very useful. |
| Display Performance to Schedule | Toggle display of the the Gantt chart
|
| Display Performance to Budget | Toggle display of the numbers grid.
|
| Use Actuals Through Date | Again, the same as the button on the main screen. Not that very useful here. |

...